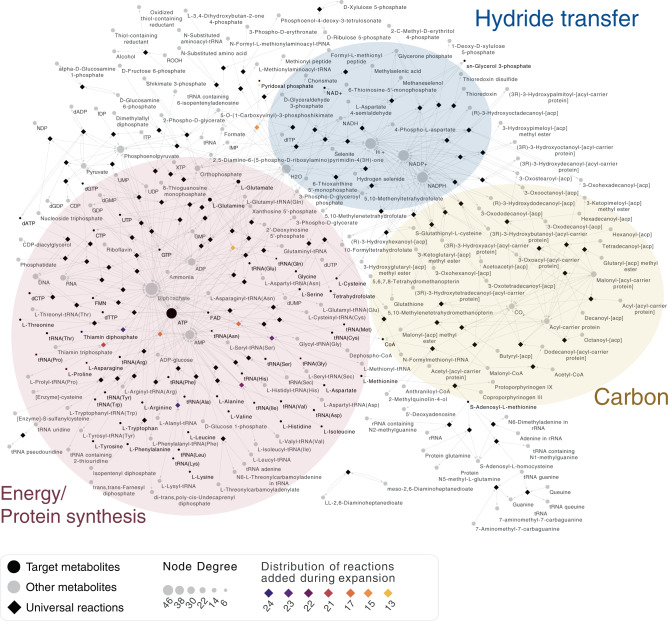
Fig. 1. Metabolic network of LBCA expanded with 9 genes to include 57 universal biomolecules.
Metabolic interconversions encoded by 146 LBCA genes plus 9 genes present in fewer groups are shown in a bipartite graph, with 243 metabolites (circular nodes) and 130 reactions (diamond nodes). Black circles represent the 57 universal target metabolites and gray circles represent the remaining metabolites. Note, however, that some of these are also universal (e.g., NADH), but directly connected to the chosen targets (e.g., in that case NAD+). Node sizes increase according to node degree. Diamonds (reactions) are colored according to the presence of genes encoding for those reactions in different taxonomic groups: in black, reactions present in all taxa; in a gradient from purple to orange reactions added during network expansion and distributed in fewer taxa (target compounds are highlighted with the same outline color if they were introduced with network expansion). Transparent colored ellipses highlight the core of energy (red) hydride transfer (blue) and carbon (yellow) metabolism.

