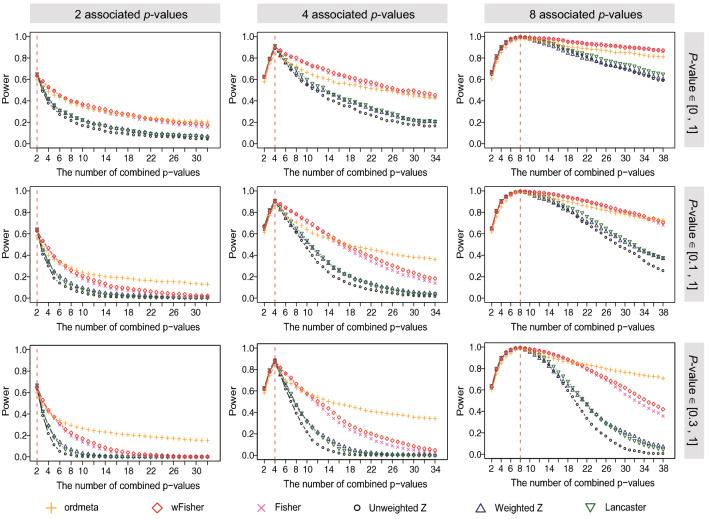
Figure 2.
t-test simulation result. Statistical power of six p-value combining methods was tested for different numbers of associated p-values, unassociated p-values, and three different ranges of unassociated p-values. The vertical dashed line represents the boundary between associated and unassociated p-values. Up to the dashed line, only associated p-values were combined. To the right of dashed line, only unassociated p-values were added. In the first, second, and third rows of figures, unassociated p-values were sampled from intervals [0, 1], [0.1, 1], and [0.3, 1], respectively.

