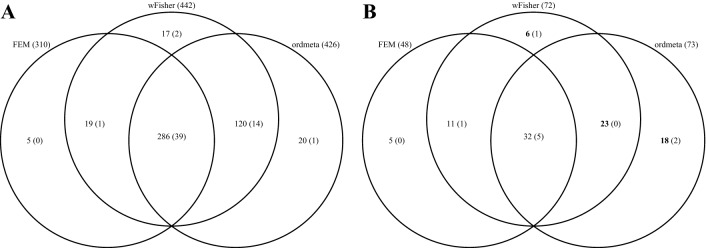
Figure 5.
Distribution of significant genes for three meta-analysis methods: fixed effects model, ordmeta, and wFisher. Counts of genes are shown (A) including and (B) excluding significant genes found from individual studies. All the nine datasets were used for the meta-analysis. Q-value of 0.01 was used to select significant genes. Counts of gold standard genes (C0376358 maligant neoplasm of prostate geneset) were shown in the bracket.

