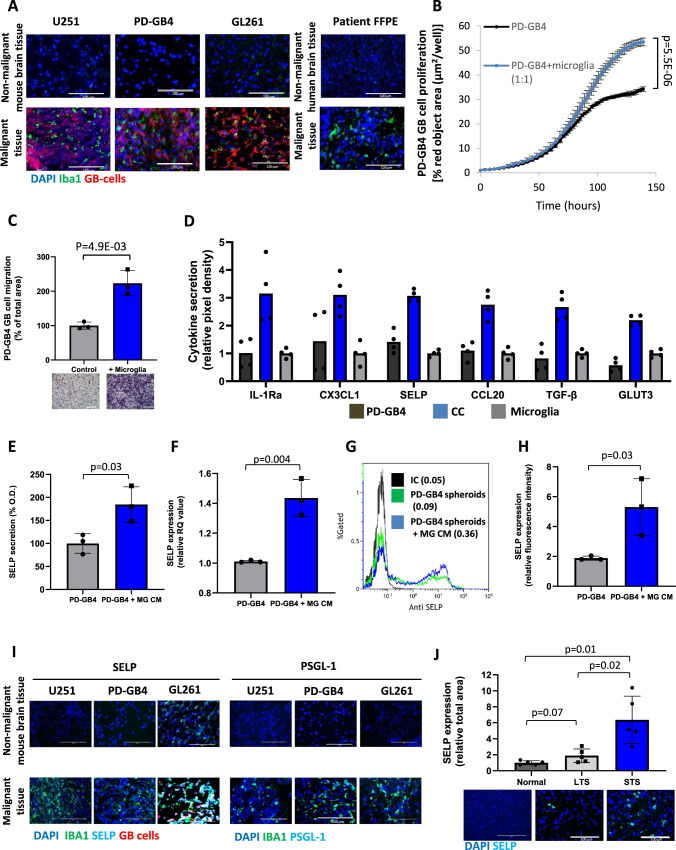
Fig. 1. Microglia facilitates the proliferation and migration rate of GB cells and enhances the expression of SELP by GB cells.
A Iba1 immunostaining showing activated microglia in GB tumors compared to normal/adjacent tissue in a GB patient FFPE sample and three GB mouse models; iRFP-labeled human U251, patient-derived (PD-GB4) GB xenografts and mCherry-labeled murine GL261, N = 3 mice or 3 patient samples. Scale bars represent 100 µm. The proliferation (B) and migration (C) rates of iRFP-labeled PD-GB4 GB cells were enhanced in the presence of human microglia. Data represent mean ± s.d. of triplicate wells. The graphs are representative of three independent repeats. Statistical significance was determined using an unpaired, two-sided Student’s t test. D Cytokine profile showing over-secretion of SELP and other factors in a co-culture of human PD-GB4 GB cells and primary human microglia compared to monocultures. Data represent mean. Duplicates were measured for each cytokine. The graph shows the average of two independent studies including internal repeats. ELISA (E) and Real-time PCR (F) results showing over-secretion and mRNA expression of SELP by PD-GB4 cells when treated with human microglia CM (MG CM) compared to naïve microglia medium. Data represent mean ± s.d. Each dot represents a triplicate. The graphs show the average of three independent studies. Statistical significance was determined using an unpaired, two-sided Student’s t test. Representative image (G) and quantification (H) of flow cytometry analysis showing over expression of SELP when PD-GB4 spheroids were treated with microglia CM compared to naïve microglia medium. Data represent mean ± s.d. The graph shows the average of three independent studies. Statistical significance was determined using an unpaired, two-sided Student’s t test. I SELP and PSGL-1 are highly expressed in tumor areas enriched with activated microglia in GB mouse models. N = 3 mice per staining. Scale bars represent 100 µm. J SELP is highly expressed in short-term survivors (STS) GB patient FFPE samples compared to long-term survivors (LTS) or normal human brain tissue. Data represent mean ± s.d. Each dot represents the average of three images per sample. N = 5 human samples per group. Scale bars represent 100 µm. Statistical significance was determined using one-way ANOVA test with multiple comparisons adjustment. Source data are provided as a Source Data file.

