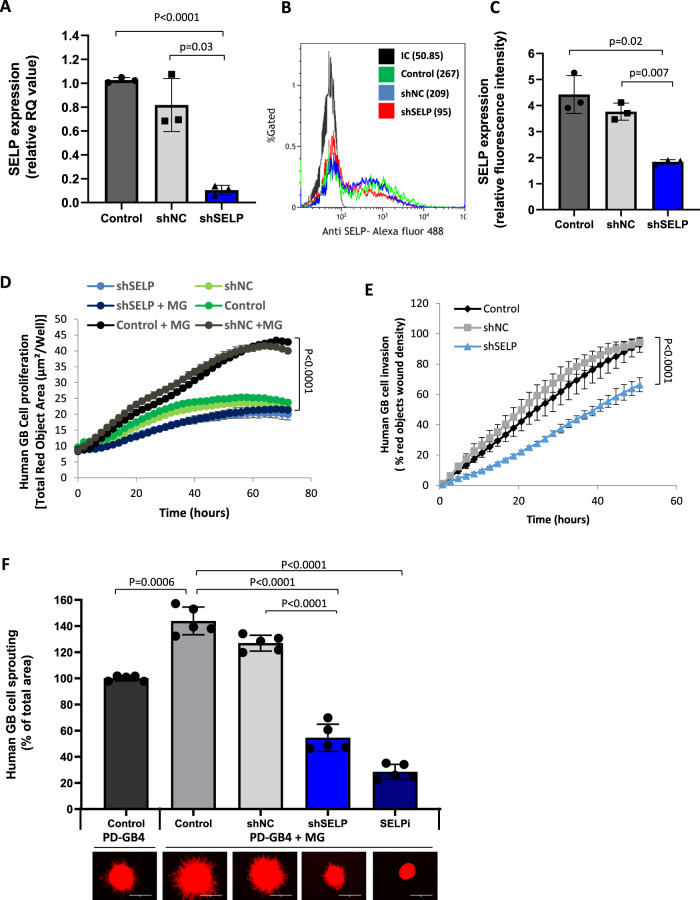
Fig. 2. SELP mediates GB cell invasion, migration, and proliferation.
A Real-time PCR showing reduced SELP mRNA levels in shSELP PD-GB4 cells, compared to control WT (Control), and negative control shRNA (shNC). Data represent mean ± s.d. Each dot represents a triplicate. The graph showing the average of three independent experiments. Statistical significance was determined using one-way ANOVA test with multiple comparisons adjustment. Representative image (B) and quantification (C) of flow cytometry analysis of SELP expression showing reduced expression in shSELP PD-GB4 compared to control WT and shNC PD-GB4 cells. Data represent mean ± s.d. The graph shows the average of three independent experiments. Statistical significance was determined using one-way ANOVA test with multiple comparisons adjustment. D Proliferation of iRFP-labeled PD-GB4 cells alone or co-cultured with unlabeled human microglia showing lower proliferation rate of shSELP PD-GB4 compared to control WT and shNC PD-GB4 cells. Cell proliferation was followed and analyzed using the IncuCyte imaging system for 72 h. Data represent mean ± s.d. of triplicate wells. The graph a is representative of three independent repeats. Statistical significance was determined using two-ways ANOVA test with multiple comparisons adjustment. E Wound healing assay using iRFP-labeled PD-GB4 cells co-cultured with microglia, showing lower migration rate of shSELP PD-GB4 compared to control WT and shNC PD-GB4 cells. Wound closure was followed and analyzed by the IncuCyte imaging system for 60 h. Data represent mean ± s.d. of 4 wells per group. The graph is a representative of three independent repeats. Statistical significance was determined using two-ways ANOVA test with multiple comparisons adjustment. F 3D spheroid invasion in Matrigel showing enhanced invasion of iRFP-labeled PD-GB4 GB cells when co-culture with unlabeled human microglia, and reduced invasion following SELP knockdown or treatment with 0.5 µM SELPi compared to untreated control WT or shNC PD-GB4 cells. Sprouting was followed for 72 h. Data represent mean ± s.d. of 5 spheroids per group. The graph a is representative of three independent experiments. Scale bars represent 100 µm. Statistical significance was determined using one-way ANOVA test with multiple comparisons adjustment. Source data are provided as a Source Data file.

