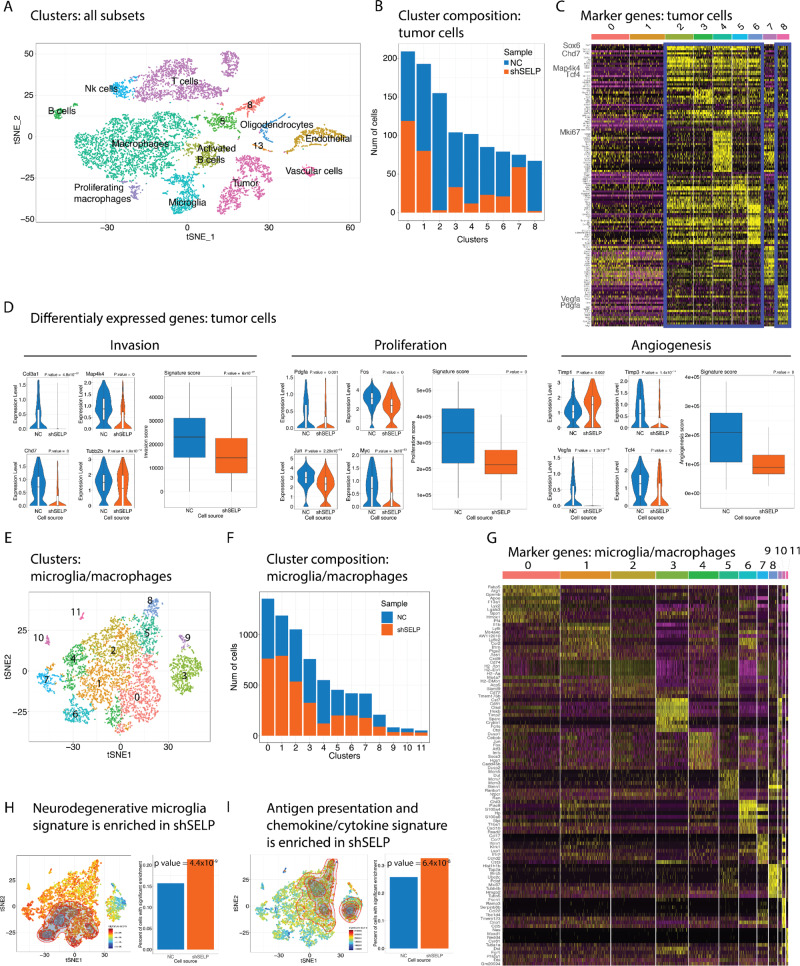
Fig. 6. Perturbation of the SELP-PSGL-1 interactions causes tumor cells to exhibit reduced tumorigenesis and the microglia/macrophages cells to express higher score of neurodegenerative and antigen presentation signatures.
A Unsupervised clustering of the single-cell RNA-seq profiles of different cell types populations of interest identified in GL261 tumors. B Clusters distribution between the shNC (NC) and shSELP groups within the tumor cell population. C Heat map showing the most up-regulated differentially expressed genes in each cluster within the tumor cells population. D Representative genes from the tumor cells clusters and comparison of gene signature scores showing down-regulation of the invasion, proliferation, and angiogenesis signatures in shSELP tumors compared to shNC. Center of the box plots shows median values, boxes extent from 25% to the 75% percentile, whiskers show minimum and maximum values. Statistical significance was determined using an unpaired, two-sided Student’s t test. E Unsupervised clustering of the single-cell RNA profiles of microglia/macrophage cells. F Bar graphs showing the number of cells present in each cluster from microglia/macrophages isolated from shNC versus shSELP GL261 tumors. G Heat map showing the ten most up-regulated differentially expressed genes in each cluster within microglia/macrophages population. H Projection of a neurodegenerative-associated microglia signature42 and bar plots showing up-regulation in shSELP tumors compared to shNC (p value = 2.2 × 10⁻¹⁶, two-sided Wilcoxon rank sum test and p value = 4.4 × 10⁻⁹ CERNO enrichment test, see “Methods”). I Projection of an antigen presentation and chemokines/cytokines microglia signature and bar plots showing up-regulation in shSELP tumors compared to shNC (p value = 8.969 × 10⁻¹⁶, two-sided Wilcoxon rank sum test and p value = 6.4 × 10⁻⁸ CERNO enrichment test, see “Methods”). The contour marks the region of highly scored cells by taking into account only cells with a signature score above the 10th percentile.

