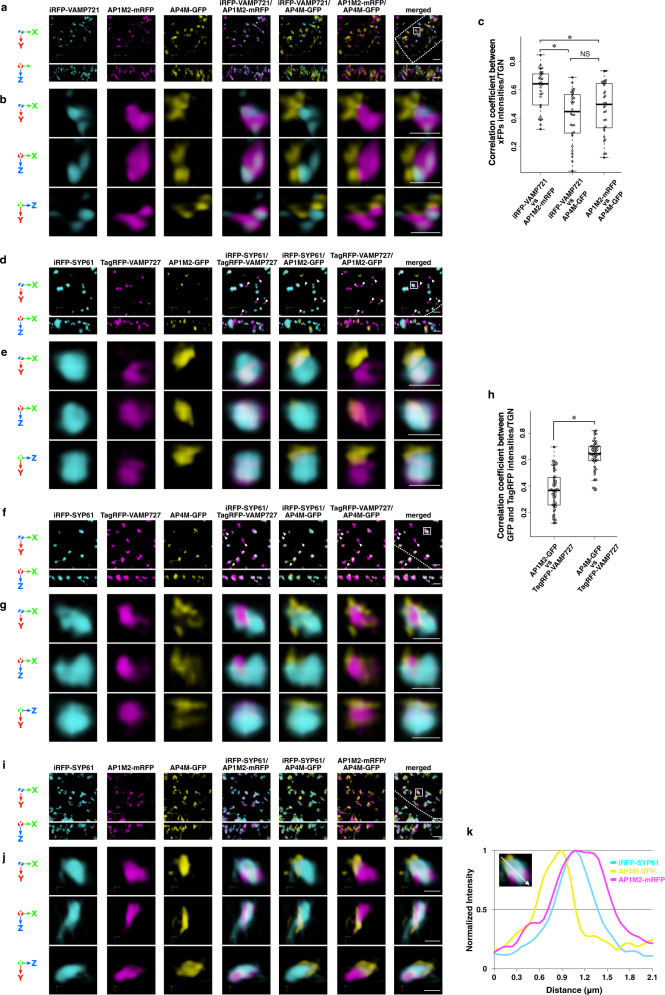
Fig. 2. Distinct suborganellar localization of VAMP721, VAMP727, AP-1, and AP-4.
a–k Three-color SCLIM imaging of root epidermal cells in the elongation zone of Arabidopsis expressing iRFP-VAMP721 × AP1M2-mRFP × AP4M-GFP (a–c), iRFP-SYP61 × TagRFP-VAMP727 × AP1M2-GFP (d, e, h), iRFP-SYP61 × TagRFP-VAMP727 × AP4M-GFP (f–h), or iRFP-SYP61 × AP1M2-mRFP × AP4M-GFP (i–k). a, d, f, i 3D images. b, e, g, j Multi-angle magnified 3D images of the boxed area in a, d, f, and i, respectively. Upper panels: top view; middle and lower panels: side view. Scale bars = 2 μm (a, d, f, i); 1 μm (b, e, g, j). Arrowheads indicate TagRFP-VAMP727 without iRFP-SYP61 and APs-GFP signals (d, e). Dashed lines indicate cell edges. c 3D colocalization analysis between μ-subunits of APs and VAMP721 on the TGN: n = 30 TGNs for each experiment, from three biological replicates. Two-sided Steel-Dwass test; P = 1.8 × 10⁻⁴ (Left: iRFP-VAMP721 × AP1M2-mRFP vs iRFP-VAMP721 × AP4M-GFP), P = 8.3 × 10⁻³ (Top: iRFP-VAMP721 × AP1M2-mRFP vs AP1M2-mRFP × AP4M-GFP), and P = 0.51 (Right: iRFP-VAMP721 × AP4M-GFP vs AP1M2-mRFP × AP4M-GFP); *P < 0.01, NS = nonsignificant. Boxes represent 25% and 75% quartiles, lines within the box represent the median, and whiskers represent the minimum and maximum values within 1.5× the interquartile range. h 3D colocalization analysis between μ-subunits of APs and VAMP727 on the TGN: n = 54 TGNs for each experiment, from five biological replicates. Two-sided Wilcoxon rank-sum test; P = 1.5 × 10⁻¹⁴; *P < 0.01. Boxes represent 25% and 75% quartiles, lines within the box represent the median, and whiskers represent the minimum and maximum values within 1.5× the interquartile range. k A graph shows normalized fluorescence intensity profile across a TGN of boxed area in i. The experiments were repeated independently three (a–c) or five (d–k) times with similar results, and photographs from representative experiments are presented.

