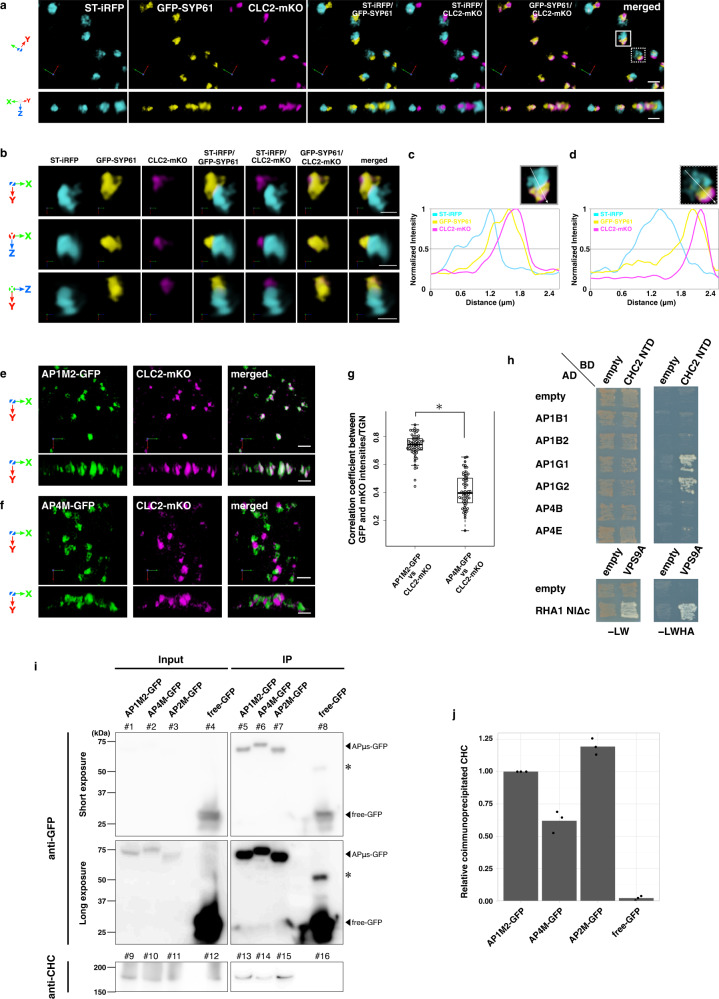
Fig. 3. Clathrin localizes on the trans-side membrane of the TGN with AP-1.
a 3D images of ST-iRFP, GFP-SYP61, and CLC2-mKO in the epidermal cell of the root elongation zone under SCLIM. b Multi-angle magnified images of boxed area in a. c, d Graphs show normalized fluorescence intensity profile across a Golgi apparatus to clathrin of boxed area and dashed boxed area in a, respectively. e, f 3D images of AP1M2-GFP and CLC2-mKO (e) or AP4M-GFP and CLC2-mKO (f) in the epidermal cells of the root elongation zone under SCLIM. Upper panels: top view; middle and lower panels: side view (a, b, e, f). Scale bars = 2 μm (a, e, f); 1 μm (b). g 3D colocalization analysis between μ-subunits of APs and CLC2: n = 60 TGNs for each experiment, from five biological replicates. Two-sided Wilcoxon rank-sum test; P = 2.2 × 10⁻¹⁶; *P < 0.01. Boxes represent 25% and 75% quartiles, lines within the box represent the median, and whiskers represent the minimum and maximum values within 1.5× the interquartile range. h Yeast two-hybrid interaction assay between AP-1 or AP-4 vs clathrin. Large subunits of AP-1 and AP-4 were expressed as the fusion protein with an activation domain (AD) and an amino-terminal domain of CHC2 (CHC2 NTD) was expressed as the fusion protein with a DNA binding domain (BD) in the yeast strain AH109. Transformants were plated on medium lacking Leu, Trp, His, and adenine (-LWHA) to test for interactions between two proteins or on medium lacking Leu and Trp (-LW) for 4 days at 30 °C. The assay for RHA1 NIΔc vs VPS9A was performed as a control experiment. i Co-immunoprecipitation analysis of immunoprecipitates with an anti-GFP antibody from seedlings expressing either AP1M2-GFP, AP4M-GFP, AP2M-GFP (positive control), or free-GFP (negative control). The immunoprecipitates were immunoblotted using anti-GFP (lanes #1–8) or anti-CHC antibodies (lanes #9–16). Asterisks indicate non-specific bands. Input = 16% (anti-GFP; lanes #1–4); 1% (anti-CHC; lanes #9–12). j Densitometric quantification of CHC co-immunoprecipitated with GFP-tags. The experiments were repeated independently five (a–h) or three (i, j) times with similar results, and micrographs from representative experiments are presented.

