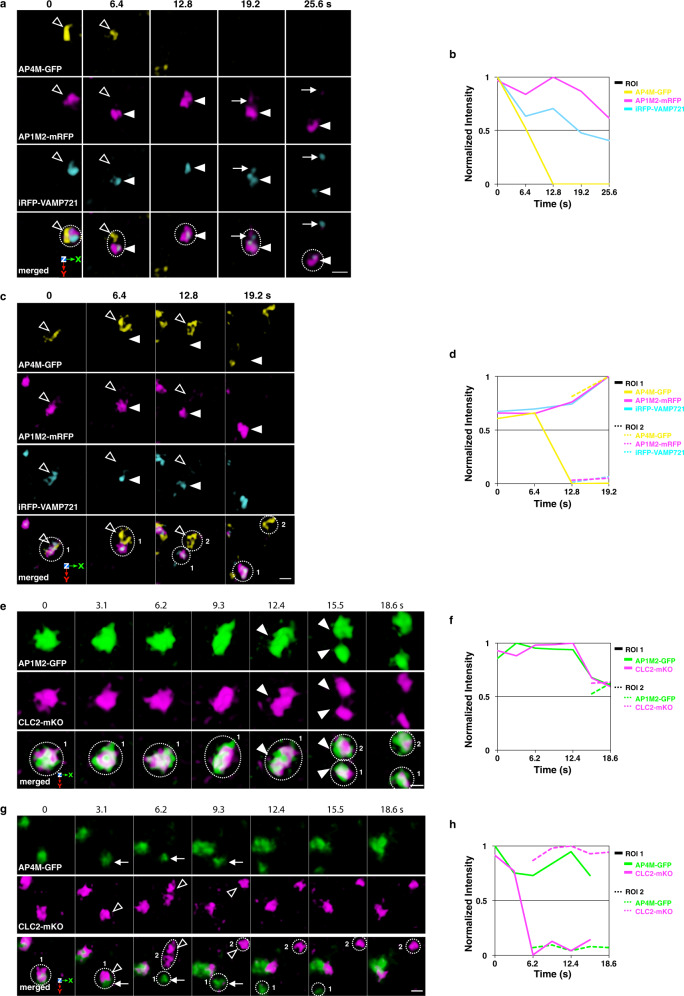
Fig. 5. AP-1, but not AP-4, behaves together with VAMP721 and clathrin.
a, c 4D images of iRFP-VAMP721, AP1M2-mRFP, and AP4M-GFP in the epidermal cells of the root elongation zone under SCLIM. Arrowheads indicate AP1M2-mRFP and iRFP-VAMP721 dissociation from AP4M-GFP or the TGN (Open arrowheads). A small punctum containing AP1M2-mRFP and iRFP-VAMP721 (arrows) separated from the TGN-detached structure (arrowheads). e, g 4D images of AP1M2-GFP and CLC2-mKO (e) or AP4M-GFP and CLC2-mKO (g) in the epidermal cells of the root elongation zone under SCLIM. Arrowheads indicate coincidental AP1M2-GFP and CLC2-mKO signal fission. Open arrowheads indicate dissociation of CLC2-mKO from AP4M-GFP (arrows). Images are lined up every 6.4 s (a, c) or 3.1 s (e, g) from left to right. b, d, f, h Time course changes in relative fluorescence intensities in ROIs of a, c, e, and g, respectively. The experiments were repeated independently four times with similar results, and micrographs from representative experiments are presented.

