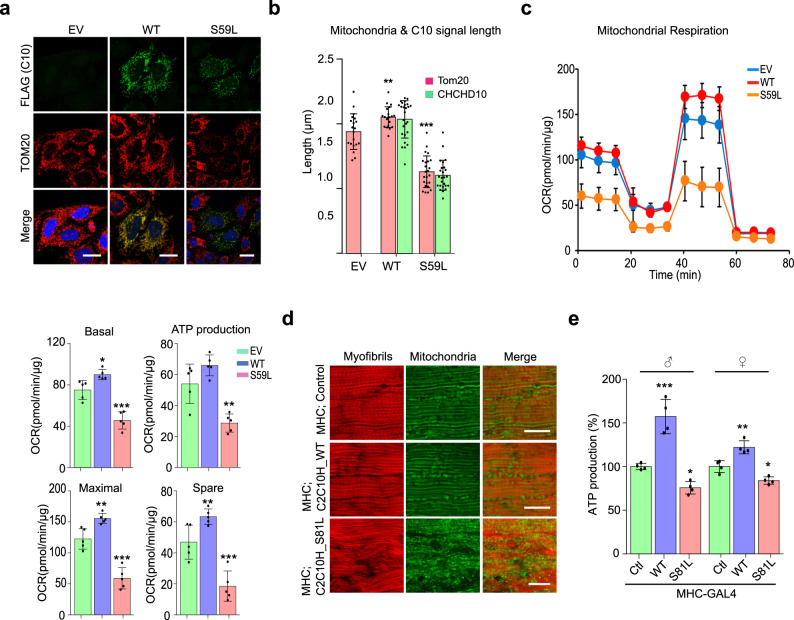
Fig. 2. CHCHD10S59L mutant induces mitochondrial defects.
HeLa cells were transfected with FLAG-tagged CHCHD10WT, CHCHD10S59L, and empty vector (EV). a Representative images from three independent experiments of HeLa cells immunostained with antibodies against FLAG (green, transfected CHCHD10) and TOM20 (red, mitochondria) 24 h after transfection. Scale bar = 20 μm. b Quantification of CHCHD10-FLAG (green) and TOM20 (red) signal length. Data are shown as mean ± SD (one-way ANOVA and post hoc Dunnett test, two-sided, comparison with EV, **p = 0.0069, ***p = 3.7e − 12; n = 20–24 cells from three independent experiments). c Oxygen consumption rate (OCR) for each transfectant was measured. After measuring basal respiration rates, oligomycin, FCCP, and antimycin A/rotenone were serially injected to measure ATP production and maximal respiration, respectively. Spare respiratory capacity was then calculated. Graphs of a single representative experiment are shown (mean ± SD). Actual statistical analyses were performed with 11 independent experiments (one-way ANOVA and post hoc Dunnett test, two-sided, comparison with EV, *p = 0.01867 and ***p = 0.00012 in basal level; **p = 0.0015 in ATP level; **p = 0.0071 and ***p = 3.2e − 05 in maximal level; **p = 0.002453 and ***p = 0.00058 in spare capacity; detailed information on statistical analyses is available in Supplementary Fig. 9a). d Mitochondrial morphology of 45-day-old C2C10HWT- and C2C10HS81L-expressing flies. Indirect flight muscles were stained with streptavidin–Alexa Fluor 488 (mitochondria, green) and phalloidin–Alexa Fluor 594 (actin filaments, red). Representative images from two independent experiments with 16 flies. Scale bar = 20 μm. e ATP levels in thoraxes containing muscle tissues of the indicated genotypes (aged 10 days) were measured. Data are shown as mean ± SD (one-way ANOVA and post hoc Dunnett test, two-sided, ***p = 0.00018 and *p = 0.03662 in male; **p = 0.0015 and *p = 0.011 in female; n = 4 independent experiments).

