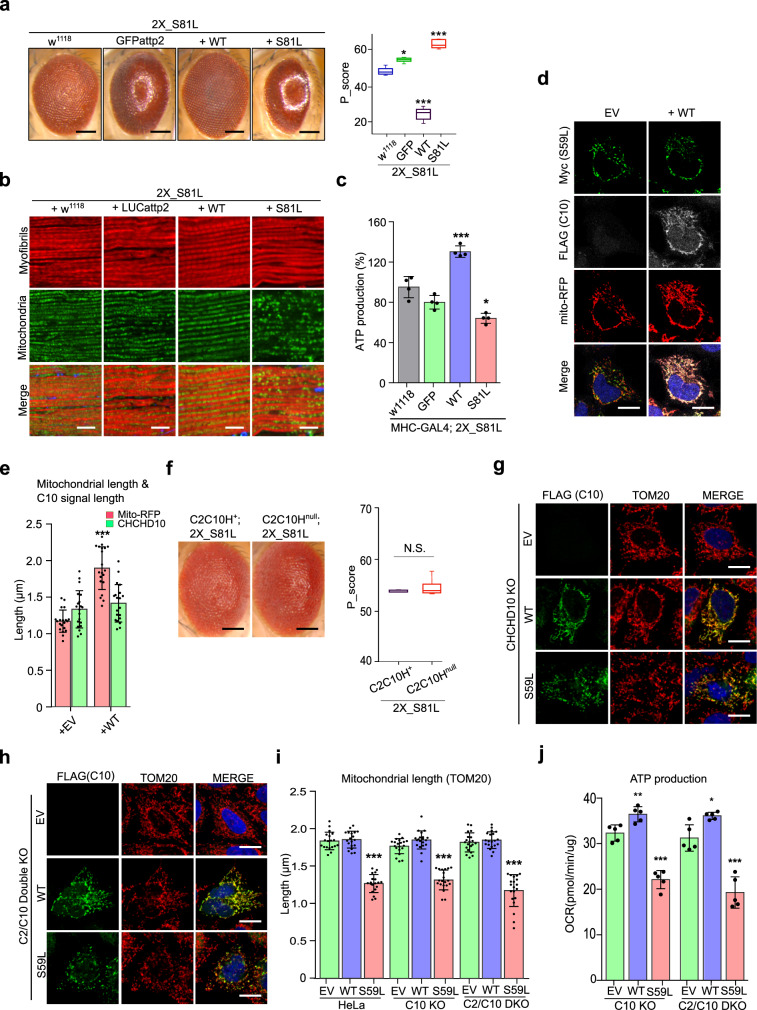
Fig. 3. CHCHD10S59L shows gain-of-toxic function.
a Expression of C2C10HWT with two copies of C2C10HS81L by GMR-GAL4 did not exacerbate C2C10HS81L-induced rough eye phenotypes. The severity of eye phenotypes was analyzed with Flynotyper31 after being processed by ilastik73. Boxes indicate median and 25th and 75th percentiles (one-way ANOVA and post hoc Dunnett test, two-sided, *p = 0.00132, ***p < 2e − 16 for WT, and ***p = 4e − 06 for S81L; n = 11, 9, 9, and 5 for w1118, GFP, WT, and S81L, respectively. Samples were collected from two to three independent experiments). Scale bar = 200 μm. b Expression of C2C10HWT with two copies of C2C10HS81L in muscle tissues did not exacerbate abnormal muscle and mitochondrial phenotypes. Scale bar = 10 μm. c ATP levels in each of the indicated genotypes were measured. Data are shown as mean ± SD (one-way ANOVA and post hoc Dunnett test, two-sided, ***p = 2.2e − 07 for W and *p = 0.0234 for S81L; n = 4 independent experiments). d HeLa cells were co-transfected with Myc-tagged CHCHD10S59L and FLAG-tagged CHCHD10WT. Empty vector (EV) was used as a control. mTagRFP-T-Mito-7 was co-transfected to visualize mitochondria. Representative images of HeLa cells stained with anti-Myc (green) and anti-FLAG (gray) antibodies 24 h after transfection. Scale bar = 20 μm. e Quantification of mTagRFP-T-Mito-7 (mitochondria) and CHCHD10S59L-Myc signal length. Data are shown are mean ± SD (two-sided t test, ***p = 5.308e − 12; n = 20 cells from three independent experiments). f C2C10HS81L-induced rough eye phenotypes were robust in the C2C10Hnull background. Boxes indicate median and 25th and 75th percentiles (two-sided t test, n = 5 flies from two independent experiments). Scale bar = 200 μm. g Representative images of CHCHD10KO HeLa cells transfected with CHCHD10WT and CHCHD10S59L. Cells were immunostained with antibodies against FLAG (green, CHCHD10) and TOM20 (red, mitochondria). Scale bar = 20 μm. h Representative images of CHCHD2 and 10KO HeLa cells transfected with CHCHD10WT and CHCHD10S59L. Cells were immunostained with FLAG (green, CHCHD10) and TOM20 (red, mitochondria) antibodies. Scale bar = 20 μm. i Quantification of TOM20 signal length (mitochondria) from CHCHD10WT and CHCHD10S59L transfected HeLa, CHCHD10KO, and CHCHD2/10DKO HeLa. Data are shown as mean ± SD (one-way ANOVA and post hoc Dunnett test, two-sided, ***p = 3.3e − 16, <2e − 16, and <2e − 16 for HeLa, C10 KO and C2/C10 KO, respectively; n = 20 cells from three independent experiments). j CHCHD10KO and CHCHD2/10DKO HeLa cells were transfected with EV, FLAG-tagged CHCHD10WT, and CHCHD10S59L. After 24 h, mitochondrial respiration for each transfectant was measured via Seahorse XF Cell Mito Stress tests. A representative graph of a single experiment is shown (mean ± SD). Actual statistical analyses were performed with three (C10 KO) and five (C2/C10 KO) independent experiments (one-way ANOVA and post hoc Dunnett test, two-sided, comparison with EV, **p = 0.0073 and ***p = 2.2e − 06 for WT and S59L in C10 KO, *p = 0.0238 and ***p = 2.1e − 05 for WT and S59L in C2/C10 KO; detailed information on statistical analyses is available in Supplementary Fig. 9b, c). NS not significant.

