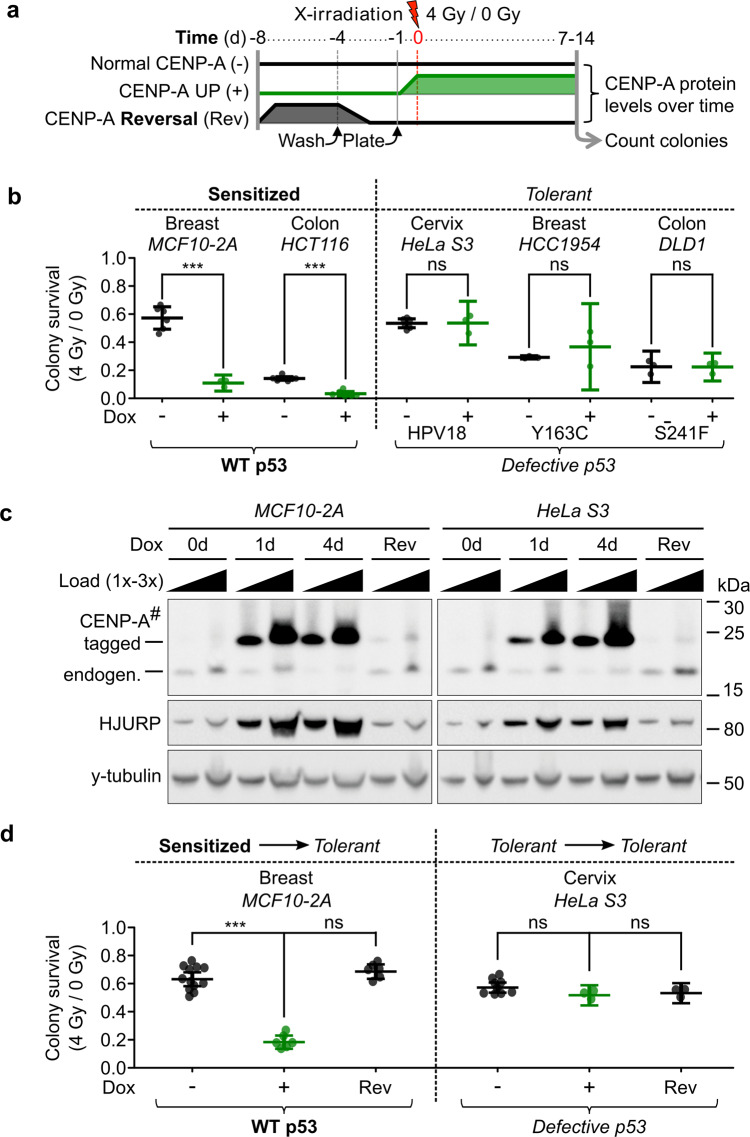
Fig. 2. Induced CENP-A overexpression causes reversible radiosensitivity in p53 wild-type cells.
a Scheme of colony formation assays (CFAs) with relative CENP-A protein levels over time for TetOn-CENPA cell lines. b CFA results corresponding to the scheme in (a) for five different cell lines of varied tissue origins and p53 status, as indicated. Each dot represents a single biological replicate. Plots show mean and 95% confidence interval. Statistical significance tested by two-tailed Welch’s t test with Bonferroni cutoff at a p value of 0.01 (α = 0.05). *** = p value < 0.0001. See also Supplementary Fig. 1C for survival ratios relative to untreated condition. c Western blot corresponding to scheme in (a): TCEs after 1 day (1d) or 4d with 10 ng/ml Dox, no Dox control (0d), or 4d Dox followed by 4d without Dox (Rev). Primary antibodies indicated on the left. 1x load = ~30,000 cells. # = high sensitivity ECL exposure. y-tubulin used as loading control. d CFA results corresponding to scheme in (a) for the indicated cell lines. Plots as in (b). Statistical significance tested by two-tailed Welch’s t test, compared to non-induced control, with Bonferroni cutoff at a p value of 0.0125 (α = 0.05). *** = p value < 0.0001.

