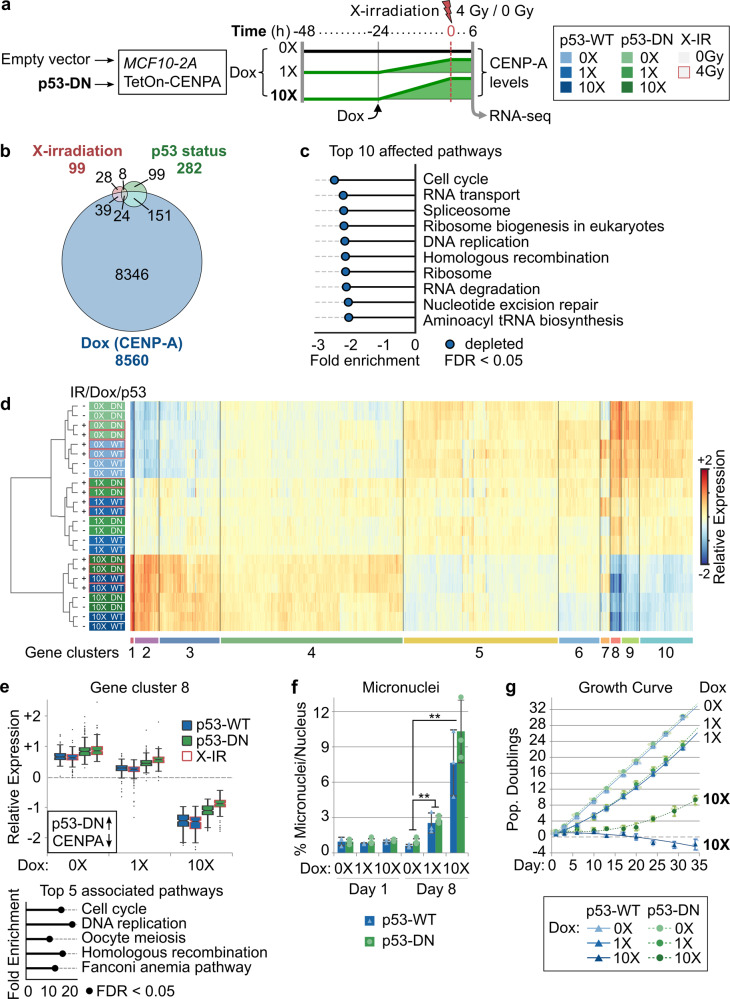
Fig. 4. Induced CENP-A overexpression promotes radiosensitivity by impairing cell cycle progression.
a Scheme delineating conditions tested by RNA-sequencing showing relative CENP-A protein levels over time and corresponding legend (pertains to (d)). All conditions tested in duplicate. See Supplementary Fig. 1F for CENP-A protein levels corresponding to 0X, 1X (10 ng/ml), and 10X (100 ng/ml) Dox. The transcriptional impact of Dox treatment alone was tested in the non-inducible MCF10-2A parental control (see Supplementary Fig. 2A, B). b Proportional Venn diagram summarizing the number of differentially expressed genes (DEGs) upon X-irradiation (red, 0 vs 4 Gy); change of p53 status (green, p53-WT vs p53-DN); and CENP-A overexpression (blue, 0X Dox vs 1X Dox vs 10X Dox). Number of DEGs in each category and overlapping categories is indicated. c Gene set enrichment analysis showing the top 10 KEGG pathways affected by CENP-A overexpression (WebGestaltR v0.4.2) and normalized enrichment score. All ten pathways are downregulated with increasing levels of Dox (i.e., significant depletion, at FDR < 0.05). See Supplementary Data 2 (GSEA) for all significantly depleted/enriched processes. d Heat map showing hierarchical clustering of samples (rows, colored according to legend in (a)) and DEGs (columns), with the ten main gene clusters annotated below. Relative expression: expression relative to the average for a given gene across all conditions (mean-centered counts, log2 transformed, and TMM normalized). See also Supplementary Data 2 for normalized counts, differential expression analysis, and cluster assignment for all genes and conditions. e Top: box plot showing the distribution of expression levels for DEGs in cluster 8 according to experimental condition. Center lines show the medians; box limits indicate the 25th and 75th percentiles; whiskers extend 1.5 times the interquartile range from the 25th and 75th percentiles; outliers represented by dots. See Supplementary Fig. 2C for all gene clusters. Black box: for genes in this cluster, p53-DN increases expression (up arrow) and CENP-A overexpression decreases expression (down arrow). Bottom: top 5 enriched KEGG pathways (WebGestaltR v0.4.2) for genes within cluster 8 based on overrepresentation analysis (ORA). All five terms are significantly overrepresented (FDR < 0.05). See Supplementary Data 2 (ORA) for top 10 pathways for all clusters. f Accumulation of micronuclei pertaining to days 1 and 8 of MCF10-2A TetOn-CENPA-FLAG-HA cells with either empty vector (p53-WT) or dominant-negative p53 (p53-DN) grown continuously with 0X Dox, 1X Dox (10 ng/ml), or 10X Dox (100 ng/ml). Plots show mean and 95% confidence interval for three biological replicates (triangles/circles) from a single experiment. Statistical significance tested by two-tailed Welch’s t test with Bonferroni cutoff at a p value of 0.01 (α = 0.05). No significant differences between p53-WT and p53-DN samples with same Dox treatment. ** = p value < 0.001. N = > 1000 nuclei per condition for each replicate. g Growth curve of MCF10-2A TetOn-CENPA-FLAG-HA cells with either empty vector (p53-WT) or dominant-negative p53 (p53-DN) grown continuously with 0X Dox, 1X Dox (10 ng/ml), or 10X Dox (100 ng/ml). Growth curve shows number of population doublings relative to the initial seeding population at day −1. Circles/triangles show mean and 95% confidence interval for three biological replicates (smaller circles/triangles) at each time point where cells were counted. Lines show best-fit curves. Similar results were obtained for a second independent experiment (see Supplementary Fig. 3G for growth curve of the non-inducible parental MCF10-2A cells after Dox exposure).

