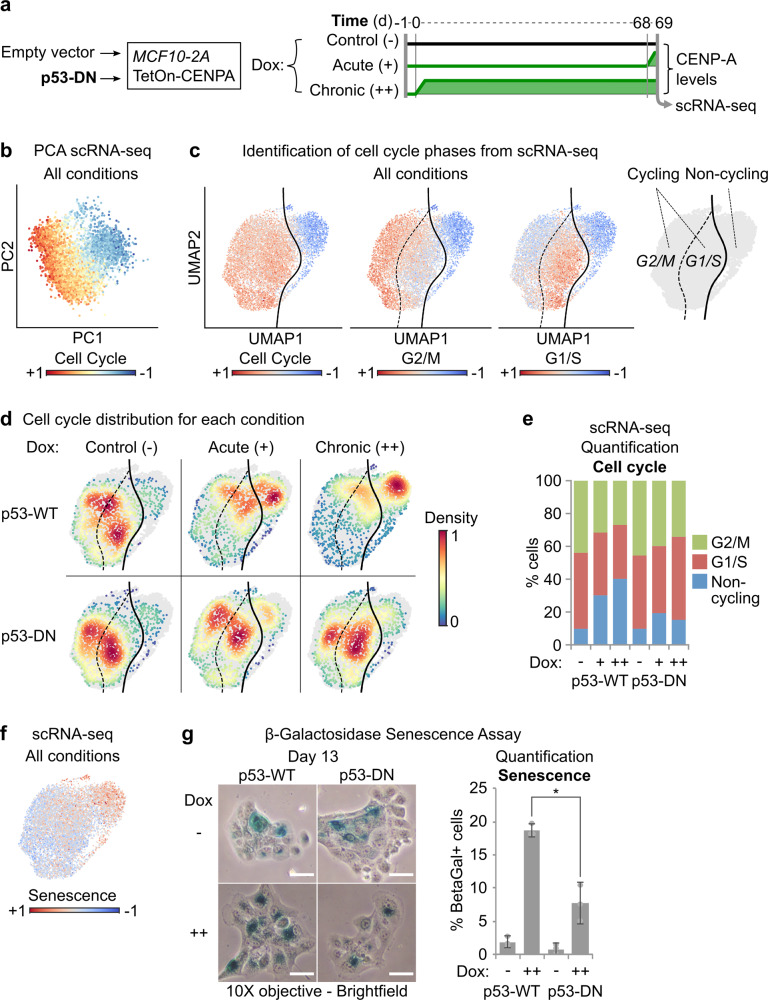
Fig. 5. CENP-A overexpression promotes acute cell cycle arrest and senescence in p53-WT cells.
a Scheme delineating conditions tested by single-cell RNA-sequencing showing relative CENP-A protein levels over time (pertaining to b–f, Fig. 6a–d, Supplementary Figs. 4B, C and 5A–D, and Supplementary Data 3). b Principal component analysis (PCA) of all scRNA-seq samples, illustrated in (a). All conditions merged. Each dot represents a single cell on the first two principal components (PC1 and PC2), colored by expression of cell cycle genes (cell cycle signature includes all genes from Cyclebase v3.0, CENPA excluded). c Uniform Manifold Approximation and Projection (UMAP) maps of scRNA-seq data, pertaining to scheme in (a). All conditions combined. Each dot corresponds to an individual cell projected in a 2D space where the topology reflects global similarities in expression. The color gradient is proportional to the expression of cell cycle, G2/M, and G1/S genes (Cyclebase v3.0). Far right plot: boundary between cycling (G2/M or G1/S) and non-cycling cells in UMAP space computed by support vector classification. d Cell density by condition (color gradient) in UMAP space for each scRNA-seq experimental condition, pertaining to scheme in (a). e Stacked bar plot showing the % of cells in G2/M, G1/S, and non-cycling scRNA-seq clusters for each experimental condition. f UMAP of scRNA-seq data as in (c) for all conditions merged, colored by expression gradient of senescence-associated genes (Fridman Senescence Up gene set from MSigDB v6.2). g Beta-galactosidase senescence assays. Left: representative brightfield images after 13 days of growth without Dox (−) or with chronic Dox (10 ng/ml, ++), taken with a 10X objective. Scale bars = 20 µm. Only cells with dark blue staining were considered senescent. Right: quantification of frequency of senescence, showing mean and 95% confidence interval from a total of three biological replicates (gray circles) across two independent experiments. N = > 100 cells per condition per replicate. * = two-tailed Welch’s t test comparing p53-WT to p53-DN after chronic CENP-A overexpression; p value = 0.014.

