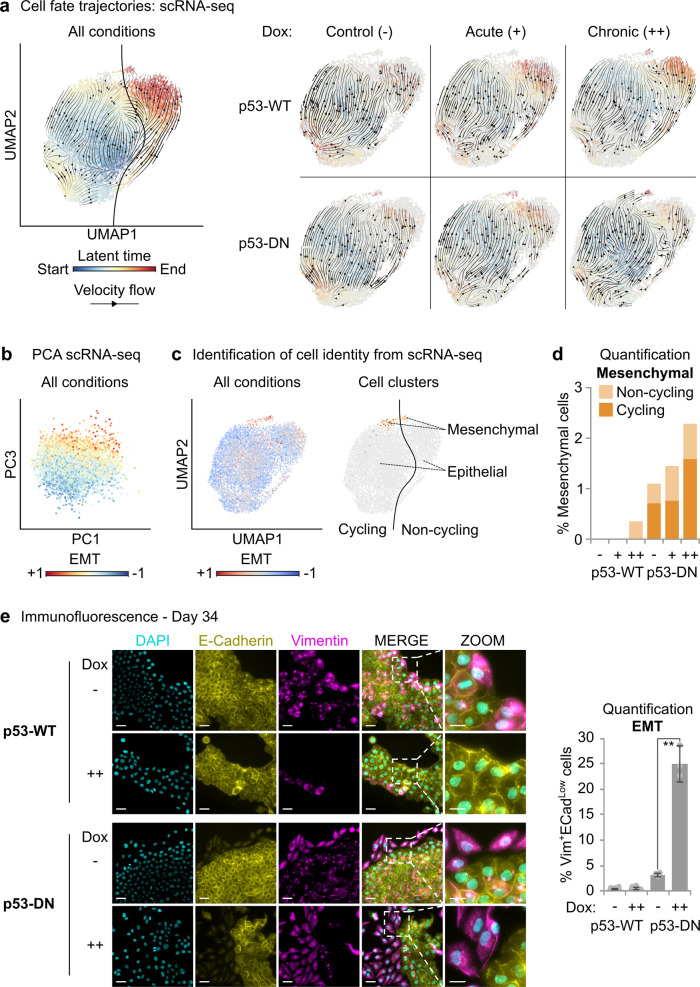
Fig. 6. CENP-A overexpression promotes epithelial–mesenchymal transition in p53-defective cells.
a Cell fate trajectories inferred by RNA velocity analysis of scRNA-seq samples illustrated in Fig. 5a. RNA velocities estimated by dynamical modeling across all samples are depicted in the left panel by a streamline plot (black arrows) showing the main directional flow across cells (gene-averaged velocity vector field in UMAP embedding from Fig. 5). Each cell is colored by the estimated latent time from initial (blue, start) to terminal states (red, end). Left: RNA velocities calculated across all conditions. Right: RNA velocities calculated separately for each condition by stochastic modeling in individual samples. b Principal component analysis (PCA) of scRNA-seq experiments. All conditions merged. Each dot represents a single cell on the first (PC1) and third (PC3) principal components, colored by expression of epithelial–mesenchymal transition genes (EMT; Hallmark gene set, MSigDB v6.2). Cell-to-cell variability along the third principal component can be explained by differences in expression of EMT genes. c Classification of epithelial and mesenchymal subpopulations based on Leiden clustering after correcting for cell cycle effects. Left: the color gradient shows, for each cell, the relative expression trend of genes involved in EMT (EMT; Hallmark gene set, MSigDB v6.2) in UMAP space. See also Supplementary Fig. 5D for additional EMT signatures. Right: classification of cells as mesenchymal (EMT high cluster, orange) and epithelial (EMT low clusters, gray), divided as either cycling (dark) or non-cycling (pale), as determined in Fig. 5. d Stacked bar plot showing the percentage of cells within the mesenchymal cluster per experimental condition. e Assessment of EMT by immunofluorescence after 34 days with (++) or without (−) continuous CENP-A overexpression (10 ng/ml Dox). Left: representative max intensity projections: DAPI (cyan), E-cadherin (yellow, epithelial marker), and vimentin (magenta, mesenchymal marker). Scale bars = 40 µm, Zoom = 20 µm. Right: quantification of the frequency of cells with high vimentin surrounding the nucleus and low/absent E-cadherin on the cell membrane for each condition. Plot shows mean and 95% confidence interval from three biological replicates (gray circles). N = > 1000 nuclei per condition per replicate. Similar results were obtained in a second independent experiment. ** = two-tailed Welch’s t test comparing control p53-DN to p53-DN after chronic CENP-A overexpression; p value = 0.0002.

