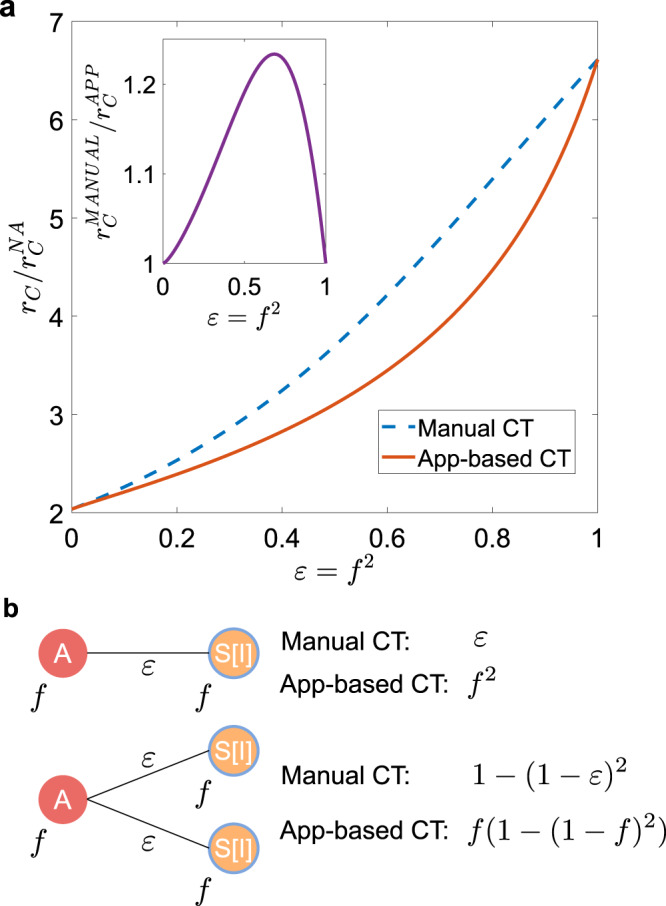
Fig. 2. Stochastic vs. prearranged sampling in contact tracing.

a Plot, as a function of ϵ = f2, of the ratio between the epidemic threshold rC in the presence of CT protocols and the epidemic threshold of the non-adaptive case . In the inset we plot the ratio between the epidemic threshold of the manual CT and that of the app-based CT , as a function of ϵ = f2. We consider homogeneous activity and attractiveness, setting ρ(aS, bS) = δ(aS − a)δ(bS − b). b If an asymptomatic node A infects a single susceptible node S (which subsequently becomes symptomatic, I), the infector is traced with probability ϵ in the manual CT and with probability f2 in the digital CT. Thus the probability is the same if we impose f2 = ϵ. However, if an asymptomatic node infects two susceptible nodes (which subsequently become symptomatic), the probability of tracing the infector with the manual protocol is 1 − (1−ϵ)2 = 2f2 − f4 (still considering ϵ = f2). This value is always larger than that of the digital protocol f(1 − (1−f )2) = 2f2 − f3.
