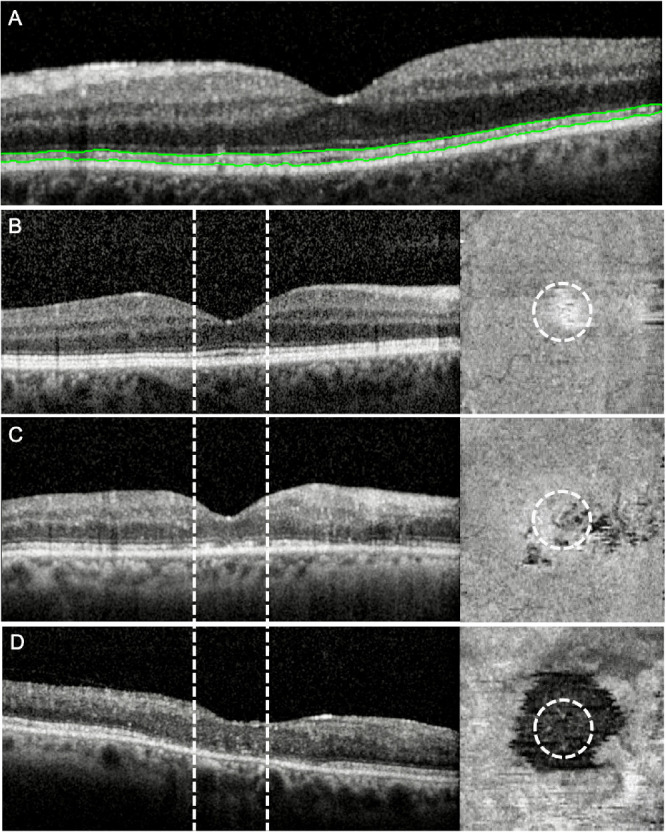
Figure 1.

Representative SD-OCT scans. (A) SD-OCT scan with segmented EZ (green lines). SD-OCT scans with corresponding en face thickness maps demonstrating normal (B), patchy (C), and absent (D) EZ within the central subfield (dashed line and circle).
