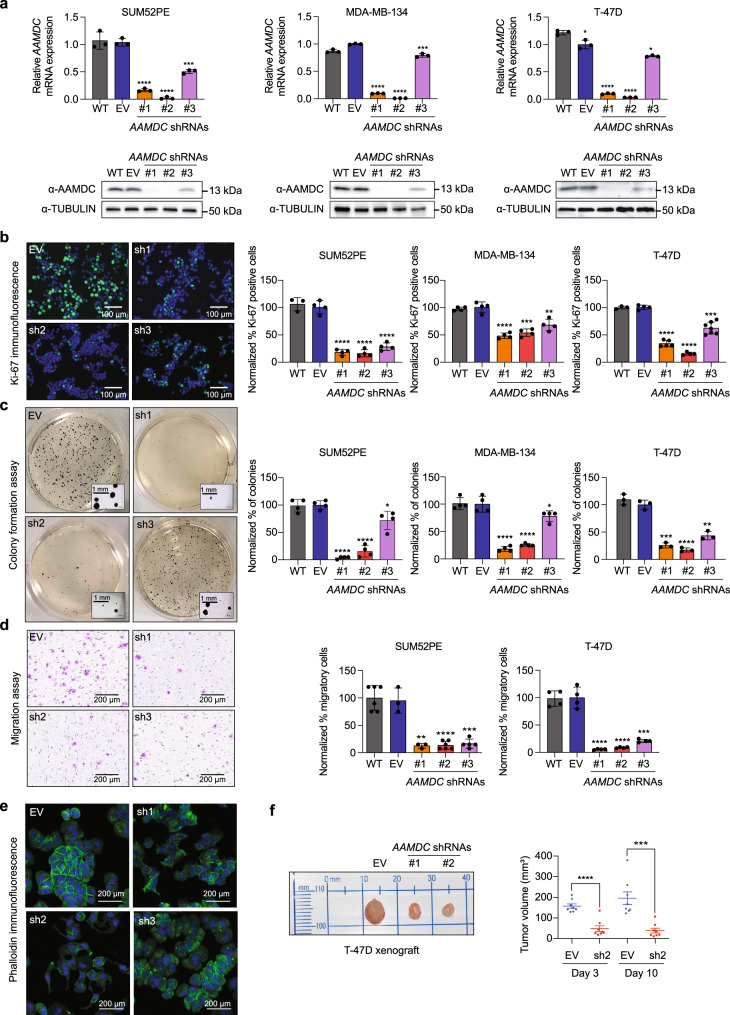
Fig. 2. AAMDC knockdown in luminal breast cancer cells inhibits tumorigenic and migratory capacity.
a Detection of AAMDC expression in luminal breast cancer cells with the AAMDC amplification (SUM52PE and MDA-MB-134) or the chromosome 11 polysomy (T-47D). Cells were transduced with either the AAMDC shRNAs #1–#3 or with empty vector (EV) and processed by qRT-PCR (top) and immunoblotting (bottom). Wild-type (WT) indicates untransduced cells. Data are normalized to the EV control and presented as mean values ± SD. p-values are determined by two-tailed unpaired t-test (SUM52PE: ***p = 0.0003, ****p < 0.0001; MDA-MB-134: ***p = 0.0004, ****p < 0.0001; T-47D: *p = 0.0142 and *p = 0.0107 for EV and shRNA #3 respectively, ****p < 0.0001). n = 3 biologically independent experiments. Source data are provided as a Source Data file. b Cell proliferation assessed by α-Ki-67 immunostaining (green), superimposed on nuclear Hoechst 33258 staining (blue). Data are normalized to the EV and presented as mean values ± SD. p-values are determined by two-tailed unpaired t-test (SUM52PE: ****p < 0.0001; MDA-MB-134: **p = 0.0044, ***p = 0.0002, ****p < 0.0001; T-47D: ***p = 0.0001, ****p < 0.0001). n = 3 biologically independent experiments. c Inhibition of anchorage-independent cell growth by depletion of AAMDC expression assessed by soft agar colony formation assay 28 days after transduction. Data are normalized to the EV and presented as mean values ± SD. p-values are determined by two-tailed unpaired t-test (SUM52PE: *p = 0.0235, ****p < 0.0001; MDA-MB-134: *p = 0.0466, ****p < 0.0001; T-47D: **p = 0.0010, ***p = 0.0002, ****p < 0.0001). n = 3 biologically independent experiments. d Inhibition of cell migration as assessed by Boyden migration chamber assays 24 h after transduction. Data are normalized to the EV and presented as mean values ± SD. p-values are determined by two-tailed unpaired t-test (SUM52PE: **p = 0.0036, ***p = 0.0004, ****p < 0.0001; T-47D: ***p = 0.0002, ****p < 0.0001). n = 3 biologically independent experiments. e Effect of the AAMDC knockdown (KD) on F-actin organization assessed by phalloidin fluorescence staining (Alexa Fluor 488, green), nuclei (Hoechst 33258, blue). In (b–e), representative images of SUM52PE cells transduced with EV or AAMDC shRNAs #1–#3 (sh1–3) are shown (left). In (a–d), quantification for each cell line transduced with empty vector (EV, blue), shRNA #1 (orange), shRNA #2 (red), shRNA #3 (lilac), and untransduced (WT, gray). f Tumor growth inhibition in vivo by AAMDC KD in the T-47D xenograft model in nude mice. Representative sizes of the tumors extracted from the animals at day 10 post-injection of the cells are shown (left). Scatter dot plot outlining the decrease in tumor volume at day 3 and day 10 post-implantation of the cells (right). EV, blue; sh2, red. Data are normalized to the EV and presented as mean values ± SEM. p-values are determined by two-tailed unpaired t-test (***p = 0.0003, ****p < 0.0001), n = 8 mice per group.

