Figure 1.

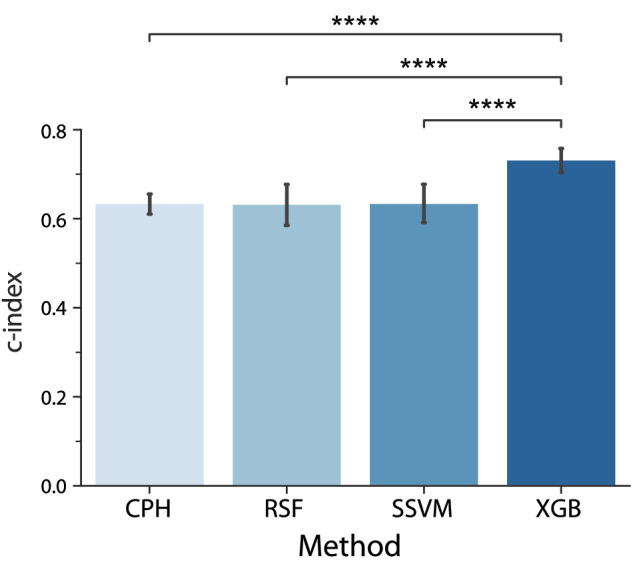
Average -index of the different models using 10-fold cross-validation. Error bars represent 95% confidence intervals across folds. . All other comparisons were non-significant () and are not shown for the sake of clarity.

Average -index of the different models using 10-fold cross-validation. Error bars represent 95% confidence intervals across folds. . All other comparisons were non-significant () and are not shown for the sake of clarity.