
Fig. 1. Single Bp cell isolation and the TRANSITome.
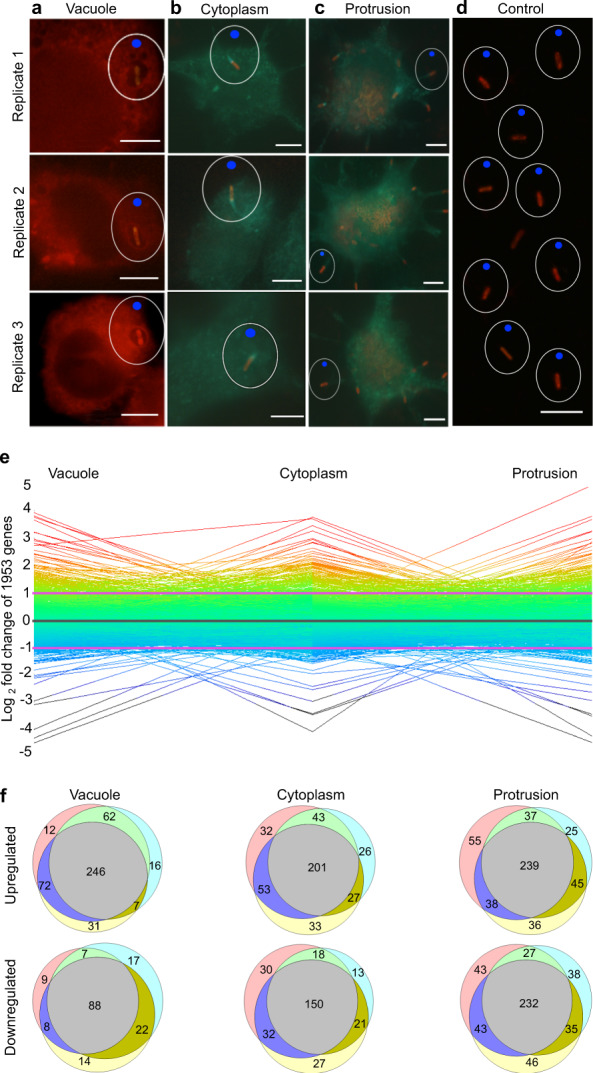
a–d YFP-RFP-tagged Bp infected RAW264.7 cells were fixed and stained red (plasma and vacuolar membranes) and green (actin). Single Bp cells were isolated from macrophage vacuoles (a), cytoplasm (b), and during membrane protrusion (c). Bp control cells were grown in DMEM medium and isolated as the baseline for gene expression analysis (d). Scale bars = 5 μm. Single bacterial cells were cut with the focused laser (white circle) and catapulted using the low-intensity unfocused laser (blue dot) by LCM. e Bp undergoes dynamic gene expression changes relative to the control cells as it transits through the host cell. Each line represents a single gene with log2FC represented in a rainbow color scheme (red lines are upregulated, black lines are downregulated). f Genes upregulated (log2FC > 1) and downregulated (log2FC <−1) showed high reproducibility among biological triplicates. Each color circle represents a biological replicate with gray representing overlap in all biological replicates. Numbers represent the number of genes within each overlapping section of the Venn diagram.