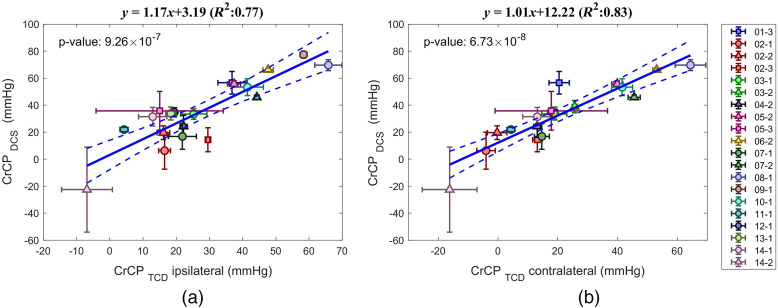
Fig. 4.
DCS versus TCD-based mean and standard deviation of CrCP. (a) TCD ipsilateral to the stroke, (b) TCD contralateral to the stroke. Different subjects are labeled with different colors. Session 1, circle; session 2, triangle; and session 3, square. Dashed lines mark the confidence interval of the linear regression. Removing the negative point only slighty affect the correlations [(a) , (b) ].

