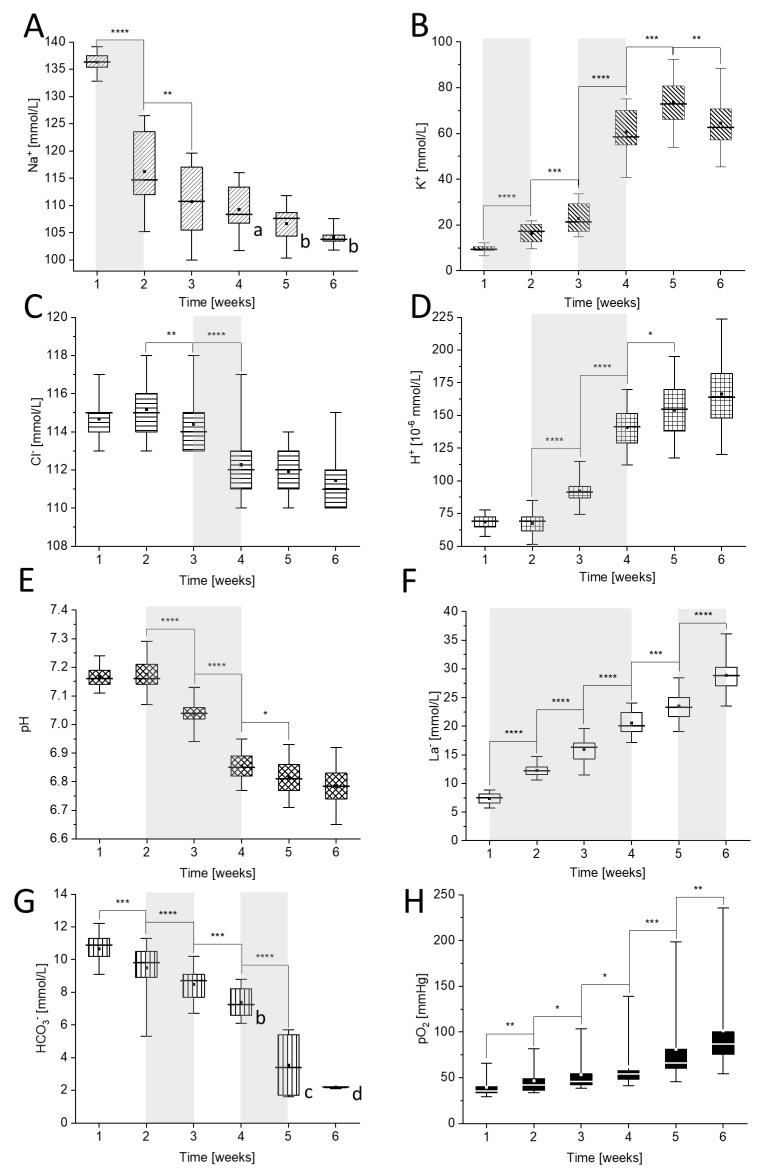
Figure 1.
Time-dependent changes in: (A) [Na+], (B) [K+], (C) [Cl−], (D) [H+], (E) pH, (F) [La−], (G) [HCO3−], and (H) pO2 during storage of packed red blood cells (pRBCs). Measurements were carried out weekly for six weeks. Letters a–d mark the results obtained for the following number of donors: (a) n = 8, (b) n = 7, (c) n = 4, (d) n = 2, while other were obtained from eleven donors (n = 11). The most prominent changes are marked gray. Data distribution is presented as box plots: median, Q1, Q3, interquartile range and min-max whiskers (Q1, Q3 indicate 25th and 75th percentiles, respectively). Data normality distribution was assessed using Shapiro-Wilk test. Statistical significance of the obtained values was tested with Kruskal-Wallis ANOVA nonparametric test (null = not significant; * p < 0.05; ** p < 0.01, *** p < 0.001, **** p < 0.0001).

