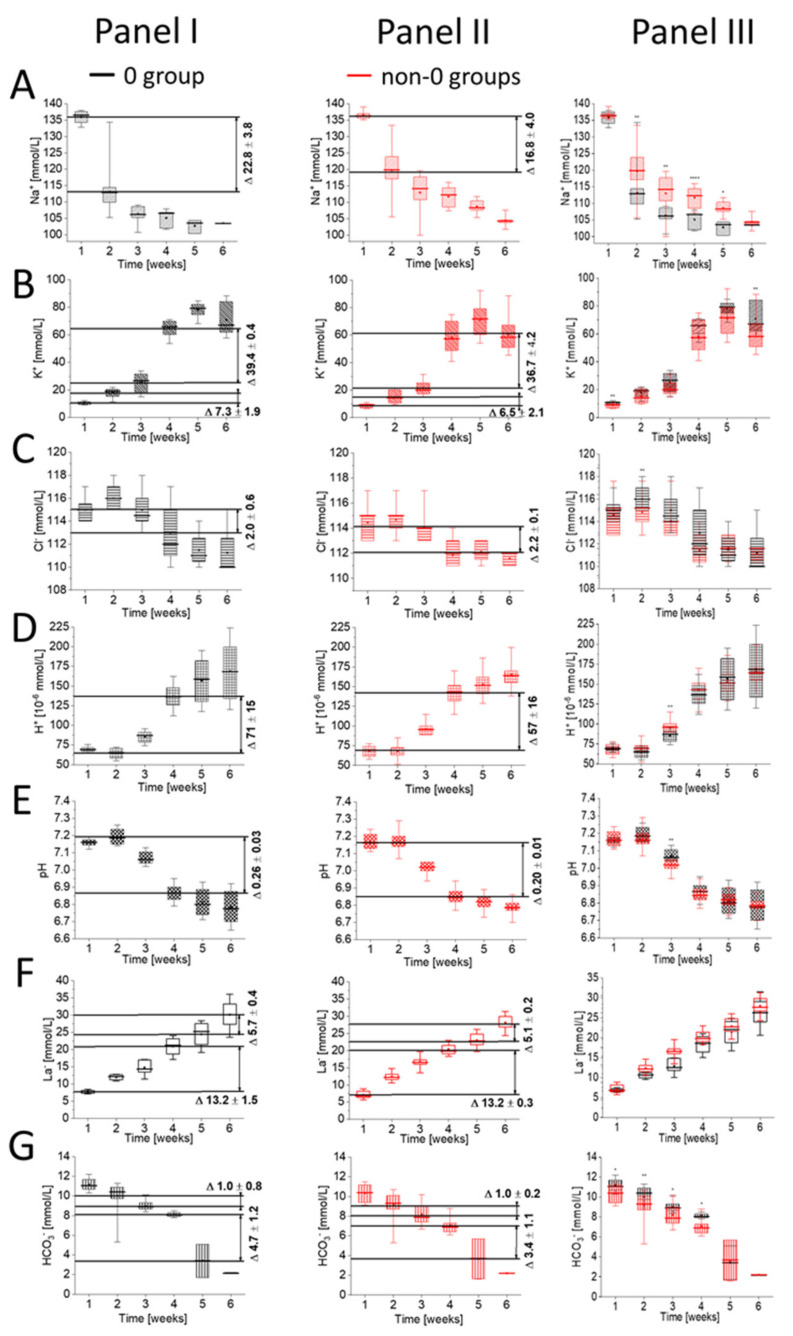
Figure 2.
Comparison of time-dependent changes in (A) Na+, (B) K+, (C) Cl-, (D) H+, (E) pH, (F) La− and (G) HCO3− concentrations between 0 (Panel I) and non-0 (Panel II) blood groups with the difference of values (∆) marked for each measured parameter in ranges marked in gray in Figure 1, which correspond only to substantial concentration changes (p < 10−4). Results are given for n = 4 (group 0) and n = 7 (group non-0). The non-0 group contains pRBCs obtained from the donors with A group (n = 4) and with B group (n = 1) and AB group (n = 2). Data distribution is presented as box plots: median, Q1, Q3, interquartile range, and min-max whiskers (Q1, Q3 indicate 25th and 75th percentiles, respectively). Data normality distribution was assessed using Shapiro-Wilk test. Panel III—Statistical significance of the obtained values for 0 and non-0 groups in each week was tested with KruskalWallis ANOVA nonparametric test (null = not significant; * p < 0.05; ** p < 0.01, *** p < 0.001, **** p < 0.0001).

