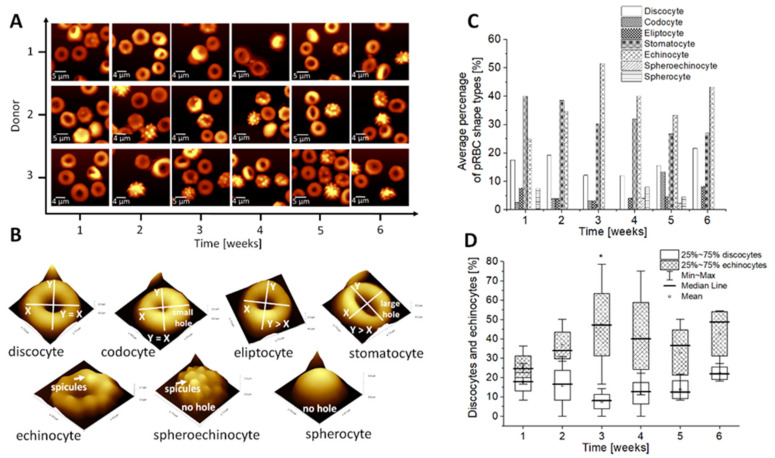
Figure 3.
(A) Representative 2D AFM images obtained during analysis of dry smears; (B) Example of 3D AFM images of different red blood cell (RBC) shape types observed during storage; (C) Time-dependent changes of the discocytes and stomatocytes observed weekly for six weeks of storage in pRBCs. Data distribution is presented as box plots (median, Q1, Q3, interquartile range, min-max whiskers). Q1, Q3 indicate 25th and 75th percentiles, respectively. Statistical significance of the obtained data (n = 3) was tested with Kruskal-Wallis ANOVA nonparametric test followed by Tukey’s post-hoc (*p < 0.05); (D) Analysis of RBC shape types as presented in (B) based on nanoscale AFM measurements analyzed weekly during six weeks of storage of pRBCs (n = 3). Besides statistically significant difference between discocytes and stomatocytes presented in (C) for the second week of storage, other results in (D) were found not significant.

