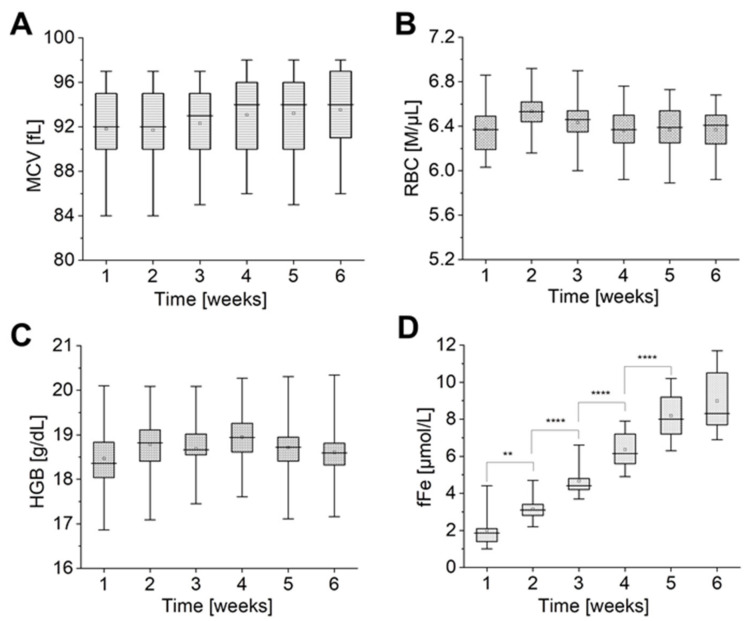
Figure 4.
Time-dependent changes in red cell quality indices: (A) mean corpuscular volume (MCV), (B) RBC and (C) haemoglobin concentration (HGB) and (D) fFe during pRBCs storage (n = 11). Data distribution is presented as box plots: median, Q1, Q3, interquartile range, and min-max whiskers (Q1, Q3 indicate 25th and 75th percentiles, respectively). Data normality distribution was assessed using Shapiro-Wilk test. Statistical significance of the obtained values was tested with Kruskal-Wallis ANOVA nonparametric test (null = not significant; ** p < 0.01, **** p < 0.0001).

