Figure 2.
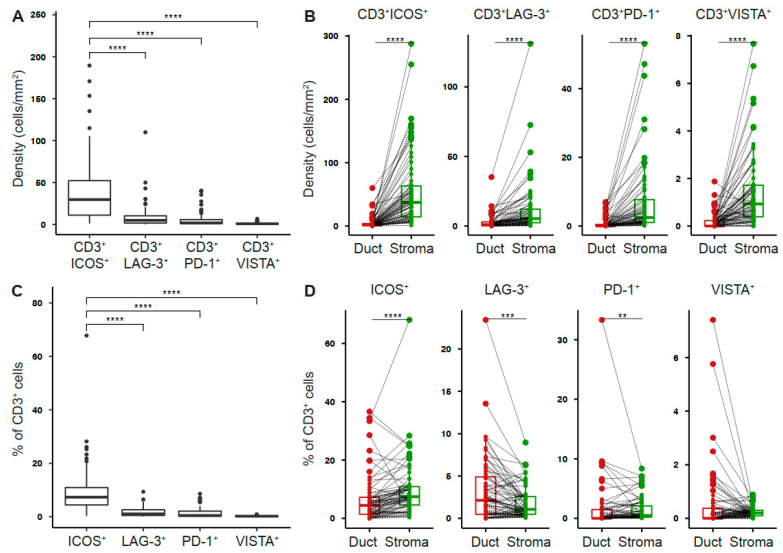
Tumor-infiltrating T cells express co-stimulatory and inhibitory receptors in pancreatic cancer. (A) Density of T cells stained positive for indicated receptor in whole PDAC and (B) ductal (red) and stromal (green) tissue areas. (C) Percentage of T cells positive for indicated receptor in whole PDAC and (D) ductal (red) and stromal (green) tissue areas. Each point represents a single patient (total, n = 69). Dot plots and box-and-whiskers (plus min-max), median. Paired Wilcoxon, and Kruskal–Wallis test and Dunn multiple comparisons test. p-values ≤ 0.05 were considered significant. **, p < 0.01; ***, p < 0.001; and ****, p < 0.0001.

