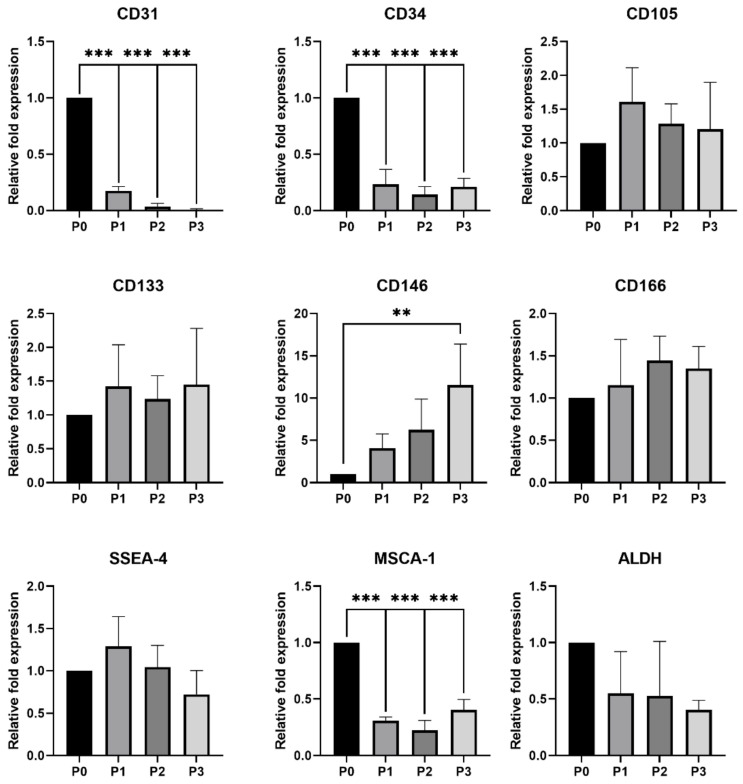
Figure 3.
Relative expression of selected markers compared among the different passages of rabbit BEPCs. P0—initial culture, P1—first passage, P2—second passage, P3—third passage. The data are expressed as the mean ± SD; **—difference is statistically significant at p < 0.01; ***—difference is statistically significant at p < 0.001.

