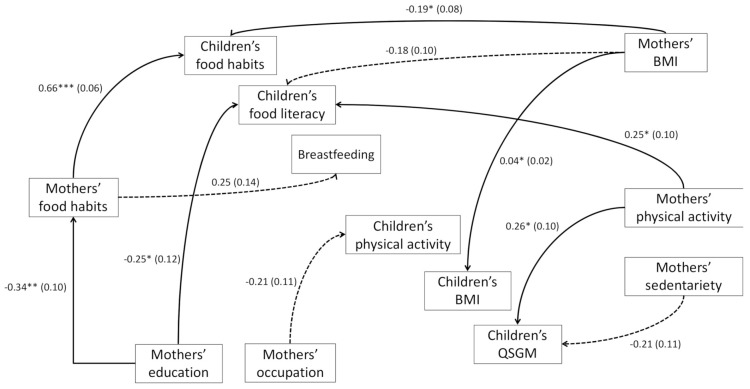
Figure 1.
Interactions between maternal and their children food and PA habits. Note: Path coefficients are presented as standardised regression weights and standard errors in parenthesis. Only significant relationships are showed; asterisks indicate the significance level (* p-value < 0.05; ** p-value < 0.01; *** p-value < 0.001). The dashed lines represent relationships with a significance level slightly above 0.05 (mothers’ BMI/children’s FL score p = 0.080; mothers’ occupation/children’s PA p = 0.061; mothers’ sedentariness/QSGM p = 0.053; mothers’ food habits/breastfeeding p = 0.073). BMI: body mass index; QGMD: quotient of gross motor development.

