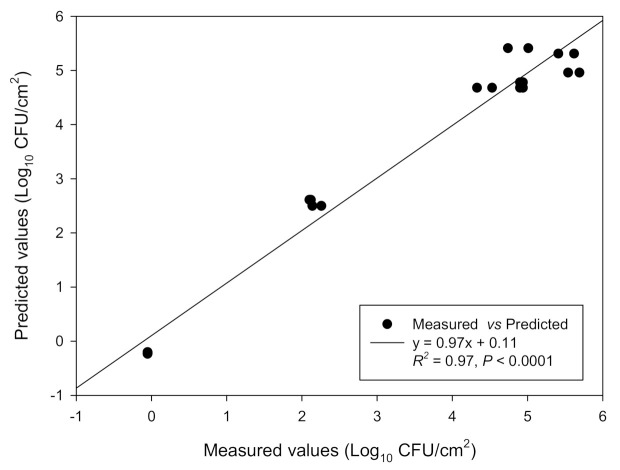
Figure 1.
Linear relationship between the measured and predicted data for the concentrations of the attached to SS coupons populations (Log10 CFU/cm2) of the four-strain L. monocytogenes cocktail. The mathematical equation of the regression plot, together with its regression coefficient (R2), are also shown. Dots represent the mean values of all experiments included in the CCRD (n = 20; i.e., those shown in Table 1). For more clarity, the bars of standard deviations have been omitted.

