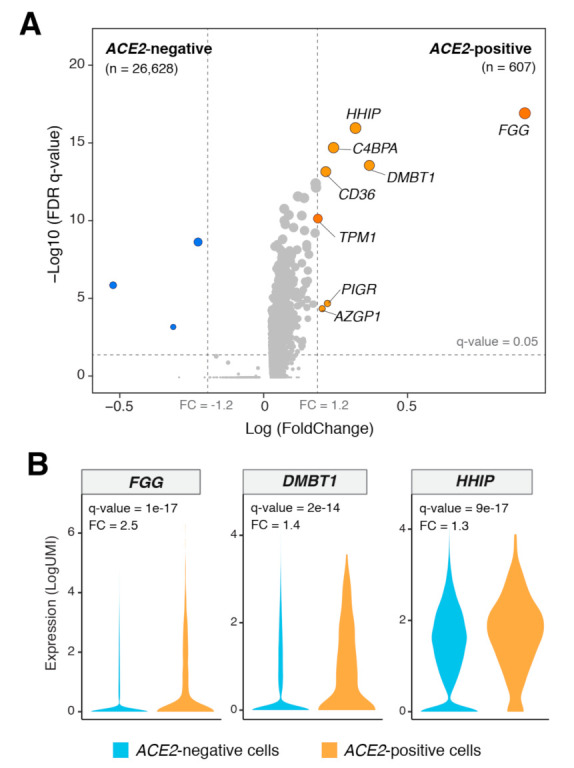
Figure 3.

Differentially expressed genes between ACE2-positive and -negative AT2 cells. (A) Volcano plot showing significantly differentially expressed genes (DEGs) between ACE2-positive (n = 607) and -negative (n = 26,628) AT2 cells. A cutoff of absolute gene expression (fold-change: >1.2) and a FDR (q-value < 0.05) were applied to identify the DEGs. Blue indicates downregulation, and orange indicates upregulation. (B) Violin plots showing the significant upregulation of FGG, DMBT1, and HHIP genes in ACE2-positive compared with -negative AT2 cells. FC: Fold change.
