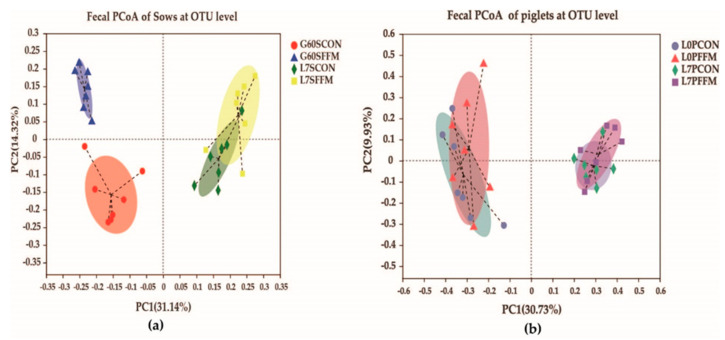
Figure 4.
Effects of FFM supplementation shown by the unweighted Unifrac values of the fecal microbiota of sows on G60 and L7 (a) and the fecal microbiota of piglets on L0 and L7 (b) at the OTU level, as determined by the principal coordinate analysis (PCoA). The Bray-Curtis method was used for the PCoA; different colors or shapes represent different groups’ samples. The closer two sample points are, the more similar the species compositions of the two samples are. N = 7 for each stage of each group. G60SCON = CON sows on G60; G60SFFM = FFM sows on G60; L7SCON = CON sows on L7; L7SFFM = FFM sows on L7; L0PCON = CON piglets on L0; L0PFFM = FFM piglets on L0; L7PCON = CON piglets on L7; L7PFFM = FFM piglets on L7.

