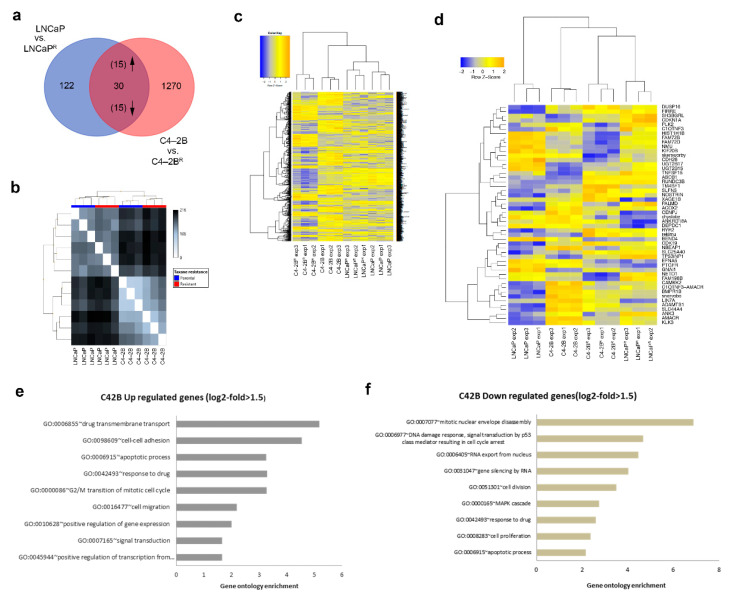
Figure 2.
Gene expression analysis of docetaxel-resistant cells. (a) Venn diagram showing the number of differentially expressed genes in the docetaxel-resistant lines compared to the parental lines. Only genes with at least 1.5-fold change in expression levels between the parental and docetaxel-resistant cells (p ≤ 0.05) were selected. (b) Distance matrix graph of analyzed samples. Distance between two samples was calculated using Euclidean metrics. (c) Heatmap of the 1300 genes that are significantly differentially expressed between parental and C4-2BR docetaxel-resistant cells and the 152 genes differentially expressed between parental and LNCaPR resistant cells. (d) Heatmap including only the genes that are differentially expressed by both LNCaPR and C4-2BR resistant cells. Heatmap visualization was performed using the gplots package in R. The intensity of the squares reflects the fold repression (blue) or fold induction (orange), according to the color scale at the top. (e,f) Selected Gene Ontology (GO) categories for the C4-2BR cell line genes, for (e) up- and (f) down-regulated genes.

