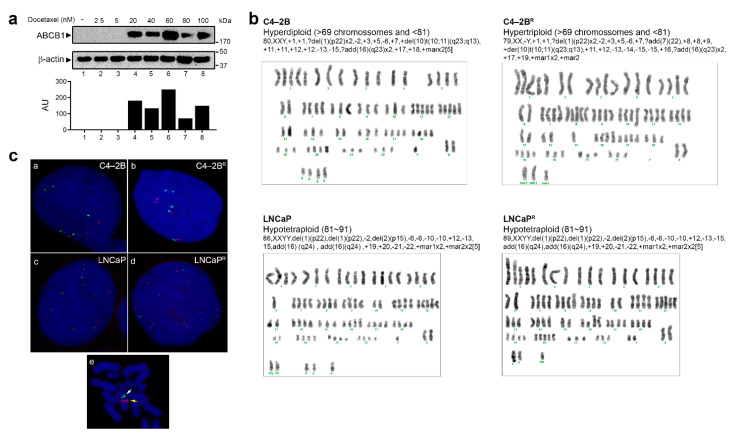
Figure 5.
Karyotypic and gene level evaluation of ABCB1 copy number in drug-resistant cell lines. (a) Western blot analysis of ABCB1 expression in consecutive passages of LNCaP and C4-2B cells generated during the process of acquisition of drug resistance. Full Western blot image can be found in Figure S1. Lower panel: graphs depicting densitometry measurements of ABCB1 levels relative to those of β-actin in arbitrary units (AU). (b) Representative G-band karyotypic analyses of the parental and docetaxel-resistant cell lines. (c) Fluorescence in situ hybridization (FISH) using probes specific for chromosome 7 centromere (Green) and ABCB1 gene (Red) was performed in C4-2B (subpanel a), C4-2BR (subpanel b), LNCaP (subpanel c), and LNCaPR (subpanel d) parental and resistant cell lines, respectively. Subpanel e shows a representative image of metaphase FISH of an LNCaP cell, confirming that the probes used recognized discrete regions in the same chromosome.

