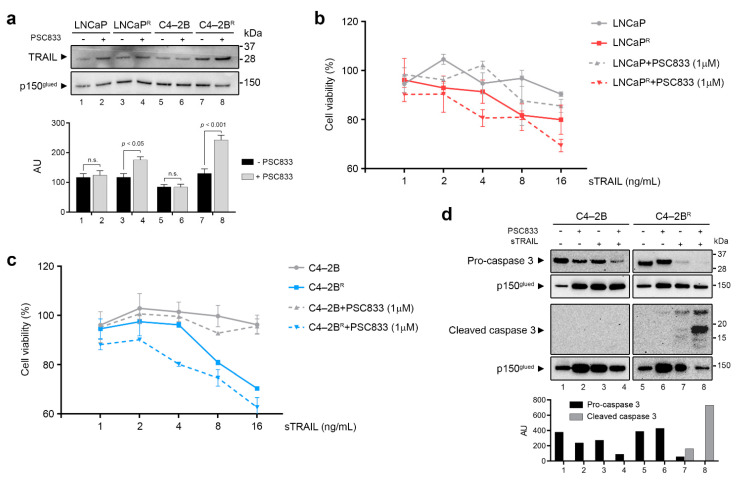
Figure 6.
TRAIL status and its role in docetaxel-resistant prostate cancer (PCa) cell lines (a) Parental and resistant cells were cultured in the presence or absence of the ABCB1 inhibitor PSC833 for 48 h and total cellular protein extracts were used to assess endogenous TRAIL expression by Western blot. Full Western blot image can be found in Figure S2. Upper panel: representative immunoblot showing levels of TRAIL protein present in whole cell extracts. P150 was used as normalizing control. Lower panel: graphs depicting pooled densitometry measurements of TRAIL levels relative to those of p150 in arbitrary units (AU). Data points are presented as mean ± SEM of triplicate measurements. (b) Cell viability was measured using MTT assay and normalized to an untreated control. LNCaP and C4-2B were treated with increasing doses of sTRAIL for 48 h. (c) LNCaPR and C4-2BR were treated for 48 h with vehicle, PSC833 alone, sTRAIL alone, or a combination of 1 μM PSC833 and increasing doses of sTRAIL. (d) Procaspase-3 and activated caspase-3 expression was assessed by Western blot after a pretreatment with PSC833 alone, sTRAIL alone, and PSC833 combined with sTRAIL. Lower panel: graphs depicting densitometry measurements of Procaspase-3 and activated caspase-3 levels relative to those of p150 in arbitrary units (AU). Full Western blot image can be found in Figure S3.

