Figure 1.
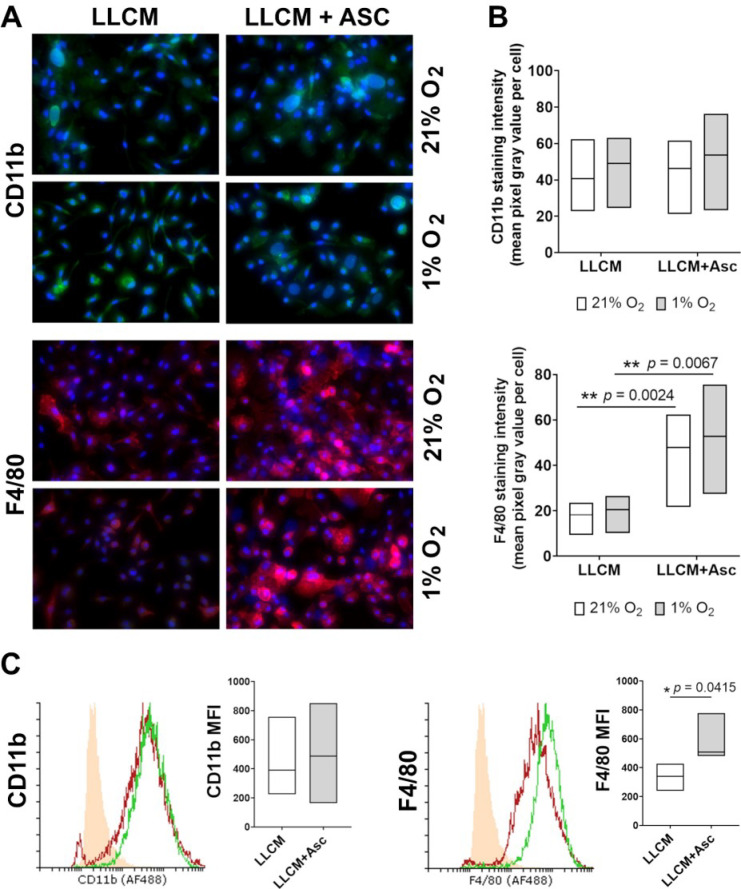
Characterization of cell surface markers of bone marrow cells grown in vitro. (A) Immunofluorescent staining of CD11b and F4/80 on bone marrow cells grown in LLCM with or without ascorbate (500 μM). Isolated bone marrow cells were grown for 7 days at ambient air (21% O2) or subjected to hypoxia (1% O2) on day 6 for ~18 h. Cells were then fixed and stained in situ for CD11b (green) and F4/80 (red); blue denotes DAPI staining for DNA. Microscope images (30×) are representative of results from one experiment (cells from one mouse). IgG control is shown in Appendix A, Figure A1. All growth conditions showed positive staining for CD11b and F4/80 in the majority of cells. (B) Densitometry analysis of CD11b and F4/80 immunostained cells represented by the mean gray pixel values per cell from 4 random fields of view per experiment (3 mice). CD11b staining did not show any statistical difference between groups. Cellular F4/80 staining was statistically more intense in the LLCM + Asc groups compared to LLCM group at the corresponding oxygen tensions. Two-tailed paired t-tests were performed, ** denotes p < 0.01. (C) Flow cytometric analysis of CD11b and F4/80 on bone marrow cells grown in LLCM with or without ascorbate at 21% O2. Isolated bone marrow cells were grown as in (A). Cells were then detached and stained for CD11b and F4/80 followed by flow cytometry analysis. Representative histograms from one mouse are shown. Solid orange histogram represents the negative control group (IgG isotype control), LLCM (red) and LLCM + Asc (green). All growth conditions showed a positive shift in CD11b and F4/80 stained cells (>90%) compared to IgG controls. Graphs show corresponding mean fluorescent intensity data from 3 individual mice, with each line representing paired outcome of one mouse. LLCM + Asc grown cells showed a significantly higher mean fluorescent intensity for F4/80 staining compared to LLCM only. Graphs shows bars with median ± min/max from 3 independent experiments. Two-tailed paired t-tests were performed, * denotes p < 0.05.

