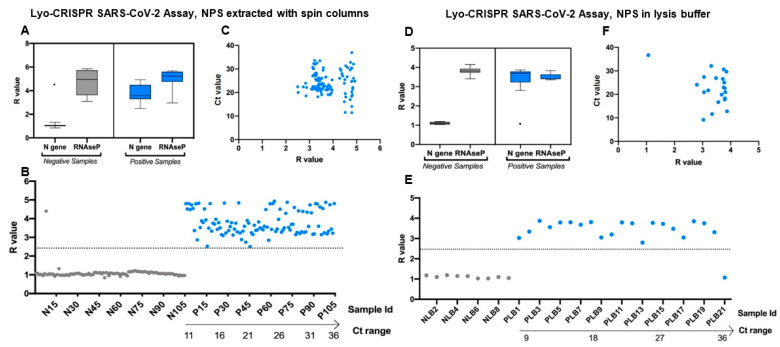
Figure 2.
Lyo-CRISPR SARS-CoV-2 kit results of 210 RNA samples extracted from nasopharyngeal swabs (NPS) using spin columns (A–C) and 30 RNA samples extracted from nasopharyngeal swabs with direct lysis (D–F). (A,D) Lyo-CRISPR SARS-CoV-2 kit results for N gene and internal control (RNAseP) in RT-qPCR-negative (grey) and -positive (blue) samples. Median, interquartile range, and range of the fluorescence ratio (R = intensity fluorescence (IF)t20 sample/IFt20 non-template control) values measured at 20 min are shown. A positive result was considered if R ≥ 2.5 or negative if R ˂ 2.5. (B,E) R values obtained for each RT-qPCR-negative (grey) and -positive (blue) sample tested. Each dot represents one sample and the dashed line represents the cutoff of the Lyo-CRISPR test to classify them. Positive samples were sorted by Ct values determined using the GeneFinder RT-qPCR kit (N gene). (C,F) R values obtained for each RT-qPCR-positive sample tested. Each dot represents one sample. N: nucleocapsid; Id: identification; Ct: Cycle threshold, R: fluorescence ratio. Figures were designed with GraphPad Prism V8 software (GraphPad, San Diego, California, USA) and BioRender.com.

