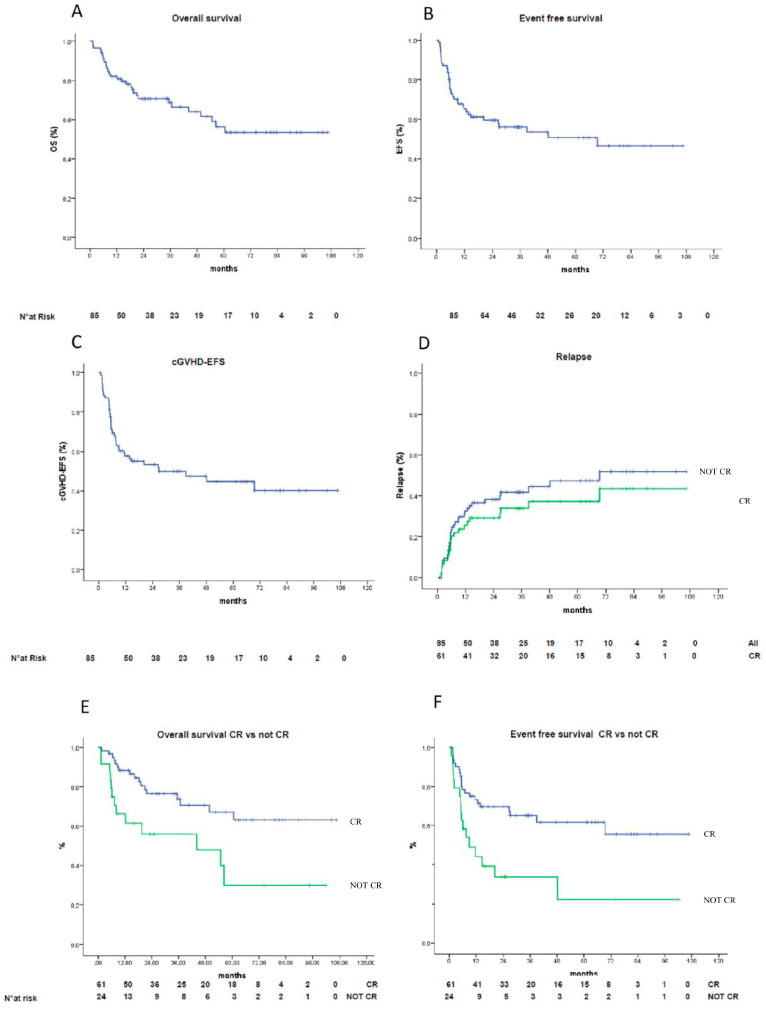
Figure 3.
Kaplan–Maier survival curves. (A) Overall survival (OS) in the overall population. (B) Event-free survival (EFS) in the overall population (C) cGVHD-EFS in the overall population, (D) Relapse-rate in the overall population (blue line) vs. CR (green line) p = 0.336), (E) OS stratified by depth of response (CR (blue line) > not CR (green line), p = 0.008). (F) EFS stratified by depth of response (CR (blue line) > not CR (green line), p = 0.003).

