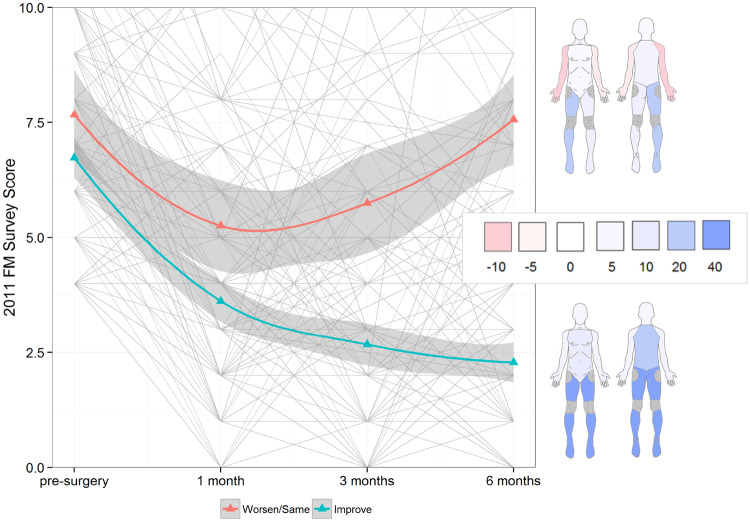
Fig. 1.
Smoothed group trajectories of the 2011 FM survey score following surgery
Individual trajectories are shown in light grey. Colours on the body map correspond to percentage changes in each group showing improvement in each region. Regions are adapted from the regional pain definitions of the 2016 Fibromyalgia Survey criteria. Shaded regions show 95% CIs.

