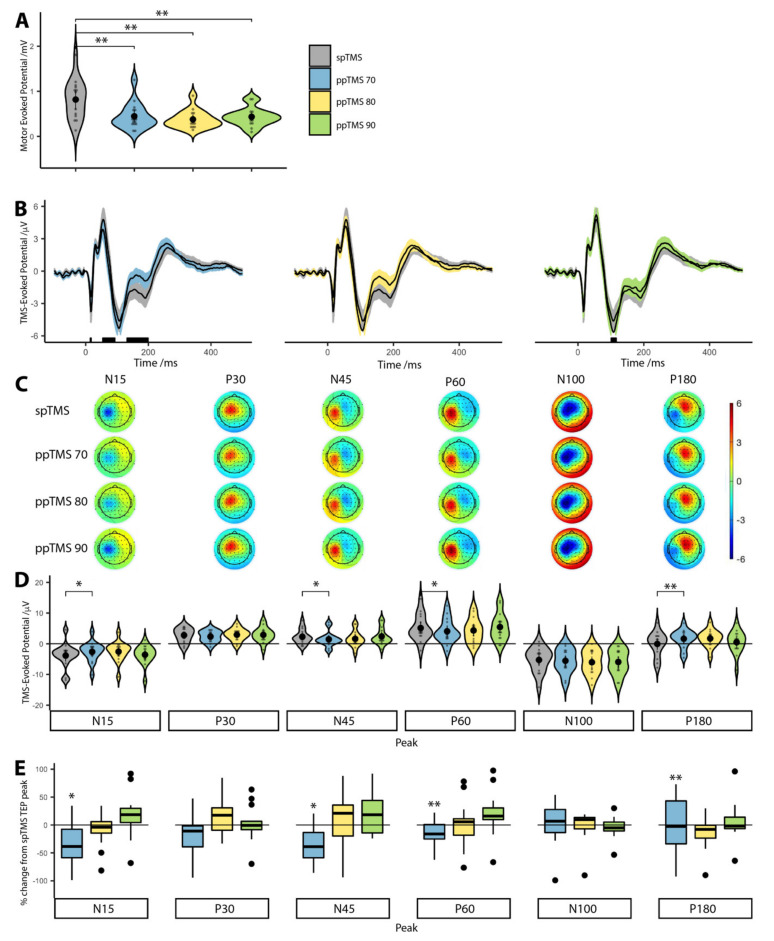
Figure 1.
Corticospinal and cortical inhibition measured during ppTMS protocols. (A): Corticospinal excitability measured by MEP amplitudes after spTMS and each of the ppTMS conditions. (B): Average TEP waveform from four electrodes around the site of stimulation (C1, C3, CP1 and CP3). Shaded areas around the TEP waveform represent standard error of the mean. Black bars under each plot represent statistically significant (p < 0.05) time points, calculated from Wilcoxon signed-rank tests, after FDR correction. (C): Scalp plots showing the TEP distribution across our six timepoints of interest, for each condition. (D): TEP peaks at six time-points (15 ms, 30 ms, 45 ms, 60 ms, 100 ms and 180 ms) are extracted for each subject and plotted for each stimulation condition. (E): Percentage change of individual TEP peaks during ppTMS conditions with respect to spTMS TEPs. Due to differences in polarity between conditions, values were squared first and then represented as a fraction of the spTMS TEP peak. Values below the dashed line depict suppression; those above depict facilitation. Asterisks represent statistically significant differences (* = p < 0.05, ** = p < 0.01).

