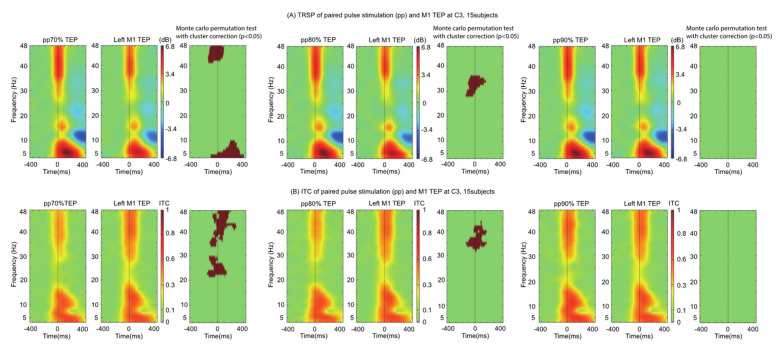
Figure 3.
TEP-related spectral perturbation (TRSP) and intertrial coherence (ITC) of spTMS and ppTMS 70, 80, 90 conditions for the C3 electrode. Top row (A) shows the 5-48 Hz TRSP with warmer colors depicting greater power and cooler colors depicting lower power. Bottom row (B) shows ITC, where values vary from 0 to 1 (1 represents perfect coherence between trials, whereas 0 represented no coherence between trials). Monte Carlo permutation tests with cluster correction are performed and shown adjacent to TRSP/ITC plots. Threshold for statistical significance is set to 0.05. Each ppTMS condition is paired with the spTMS (Left M1 TEP) condition to facilitate visualization.

