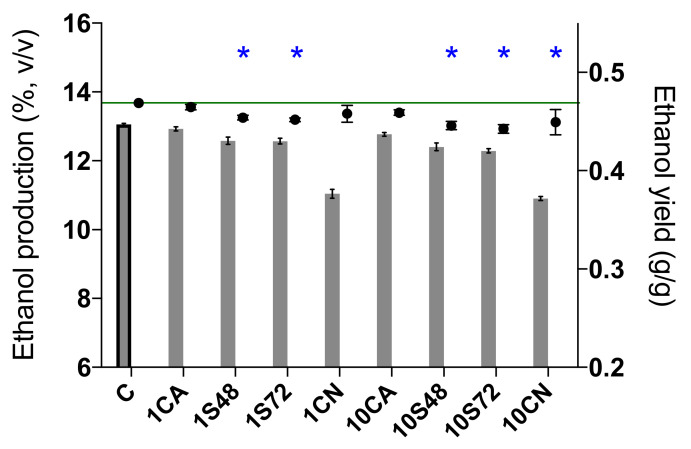
Figure 3.
Ethanol production (%, v/v) and ethanol yield (g/g) at the end of single and mixed fermentations. * indicates statistically significant differences from the control sample (C) (LSD (least significant difference) test, p < 0.05). The value of the green line is 0.47 g/g (ethanol yield of C). 1CN and 10CN were stuck fermentations.

