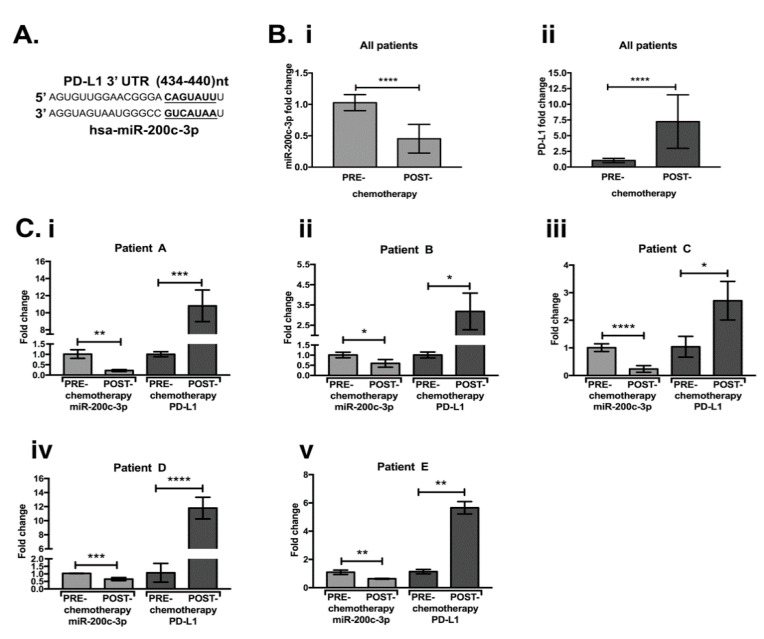
Figure 1.
MiR-200c-3p and PD-L1 expression by RT-qPCR are inversely correlated in a cohort of OC patients’ biopsies. (A): TargetScan v7.1. prediction of miR-200c-3p seed sequence, highlighted in bold letters and underlined, complements the 3′UTR of PD-L1, from 434 to 440 nucleotides (nt). (B) (i): miR-200c-3p and (ii) PD-L1 expression in a pool of five OC laparoscopic biopsies before and after chemotherapy. (C) (i–v): miR-200c-3p and PD-L1 expression analysis in the OC biopsies, comparing pre-chemotherapy to post-chemotherapy treatment in each patient (A–E). Fold change was calculated as the average of miR-200c-3p and PD-L1 expression from all five OC patients. miR-200-3p and PD-L1 fold change expression, was normalized by the housekeeping genes RNU6 and GAPDH, respectively. Fold change of miR-200c and PD-L1 expression was calculated for each OC patient as 2−ΔΔCt, considering the difference of Ct (ΔCt) mean values for each gene in the pre-chemotherapy biopsies compared to the mean of the Ct values in the post-chemotherapy biopsies. RT-qPCR measurements were repeated at least three times and in technical triplicates. Two-tailed unpaired t-test was applied for statistical significance, * p < 0.05, ** p < 0.01, *** p < 0.001, **** p < 0.0001.

