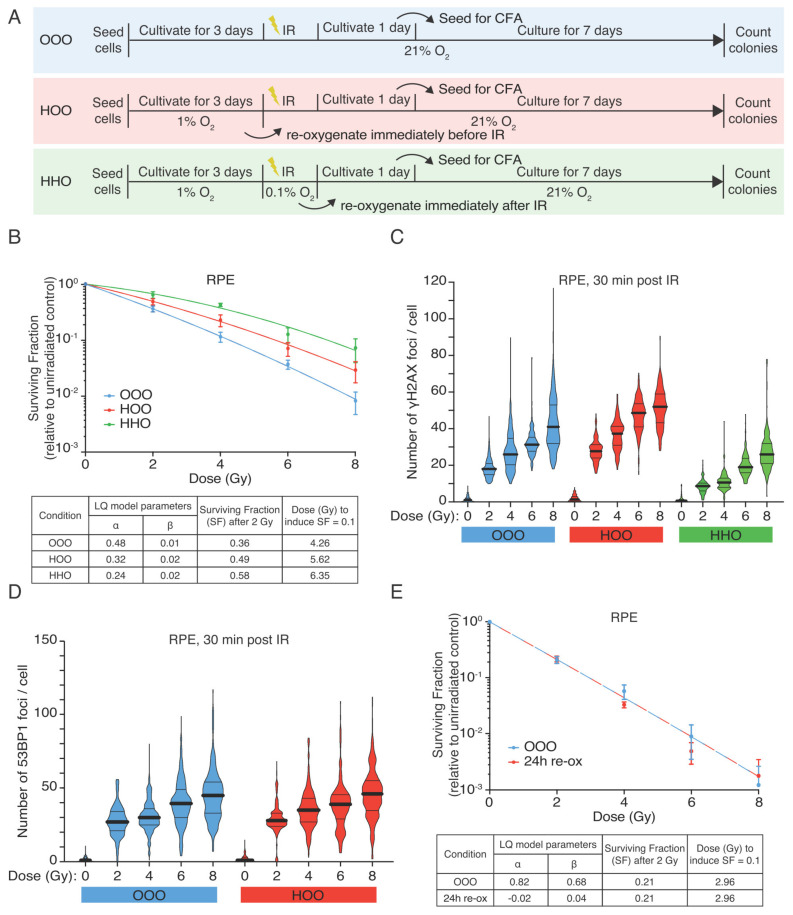
Figure 1.
Hypoxic RPE cells retain radioresistant phenotype upon reoxygenation. (A) Graphical representation of the experimental design (B) Colony-forming assay of RPEcells. RPEcells were irradiated with graded single doses of irradiation after being constantly under normoxic conditions (blue curve—OOO), for 72 h in hypoxia (1% O2) and subsequently irradiated in aerated condition (time of reoxygenation in the range of 15 min) (red curve—HOO) and after 72 h hypoxia and irradiation under hypoxic conditions (0.1% O2—green curve HHO) before been reoxygenated immediately after IR. The data points represent the means of three independent experiments, and the error bars the 95% C.I. of the means estimation. The data were fitted with linear quadratic model, the parameters of the Linear Quadratic model (LQ) of the RPE survival curves are shown collectively for all conditions in a separate table. (C) DNA DSBs measured as γH2AX foci in RPEcells 30 min after irradiation with graded single doses of irradiation under normoxic (OOO, blue violin plots) and hypoxic conditions either kept in 1% O2 for 72 h and reoxygenated just prior to irradiation (HOO, red violin plots) or also irradiated under hypoxia (0.01% O2) (HHO, green violin plots). (D) 53BP1 foci in RPE cells 30 min post-irradiation (two of the conditions as referred in (B). Black solid lines represent the population mean and the dotted lines the quartiles of the data distribution (E) Colony-forming assay of RPE-1 cells that have been kept under hypoxic conditions (1% O2) for 72 h, before being reoxygenated for 24 h and then irradiated under normoxic conditions. Data represent the pool of three independent experiments, and the error bars the 95% C.I. of the means estimation. The parameters of the LQ model are depicted in a separated table.

