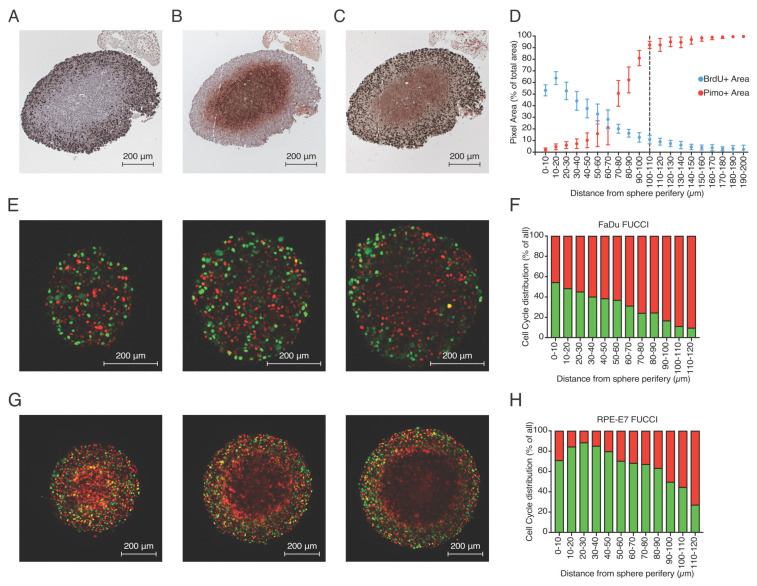
Figure 6.
Proliferation and hypoxia profile in multicellular spheroids. (A–C) Characteristic staining of three consecutive central cross-sections (3 μm distance between them) of FaDu spheroids stained for BrdU-positive cells (A), pimonidazole-positive area (B) and double staining (C). (D) Quantification of BrdU and pimonidazole signal over different distances from the outer rim of the multiple spheroids on central cross-sections of FaDu shperoids where the anti-correlation of the two parameters is depicted. (E) 2-photon microsopy image of FaDu-FUCCI spheroid cross-sections at different z-levels are depicted (extracted from Supplementary Video S1). (F) 3-D quantification of fraction of FUCCI- expressing cells location in relation to the outer rim in FaDu-FUCCI multicellular spheroids. (G) 2-photon microsopy image of RPE-E7-FUCCI spheroid cross-sections at different z-levels are depicted (extracted from Supplementary Video S2). (G) 3-D quantification of the percentage of FUCCI-expressing cells from the outer rim in FaDu FUCCI multicellular spheroids. (H) 3-D quantification of the percentage of FUCCI-expressing cells from the outer rim in RPE-E7 FUCCI multicellular spheroids.

