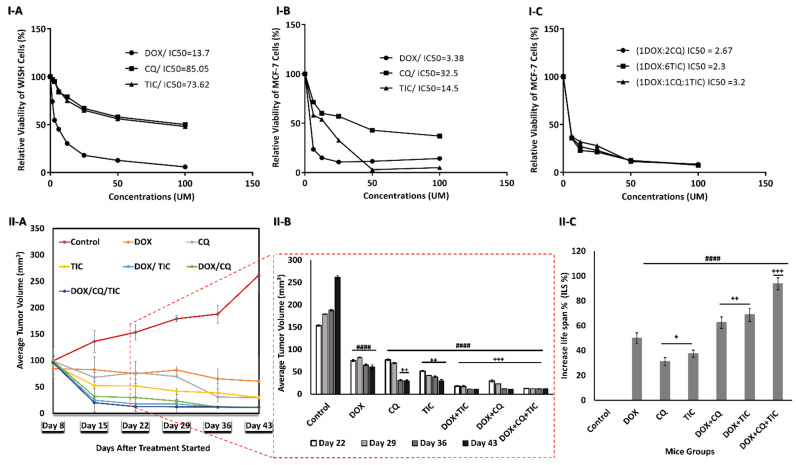
Figure 2.
Growth inhibition and aggressiveness of cancer cells assessment. The dose-response inhibition concentration was estimated via MTT assay Plot curve that showing IC50 values of every single DOX, CQ, and TIC treatment on human normal epithelial cells (WISH) cells (I-A), MCF-7 cells (I-B), and IC50 values of combinatorial therapies ratios of DOX, CQ, and TIC that achieved best combination Index (CI < 1) with a highest toxic effect on MCF-7 breast cancer cells (I-C). The cell viability was plotted against drug concentration to calculate IC50 and each data point represents an average of three independent experiments (n = 3). Growth curve for tumors of MC-7 tumor-bearing xenograft mice, with points representing mean tumor volumes in each group of mice (II-A), Bare diagram represent the dramatical difference point change of mean tumor volumes in each group of mice (II-B), Average survival time per each group of MCF-7 mice model (II-C). Results are expressed as mean ± SE (n = 3). # p < 0.05, ## p < 0.01, ### p < 0.001, #### p < 0.0001 compared with control (MCF-7-mice untreated group). + p < 0.05, ++ p < 0.01, +++ p < 0.001, ++++ p < 0.0001 compared with the DOX treated mice group.

