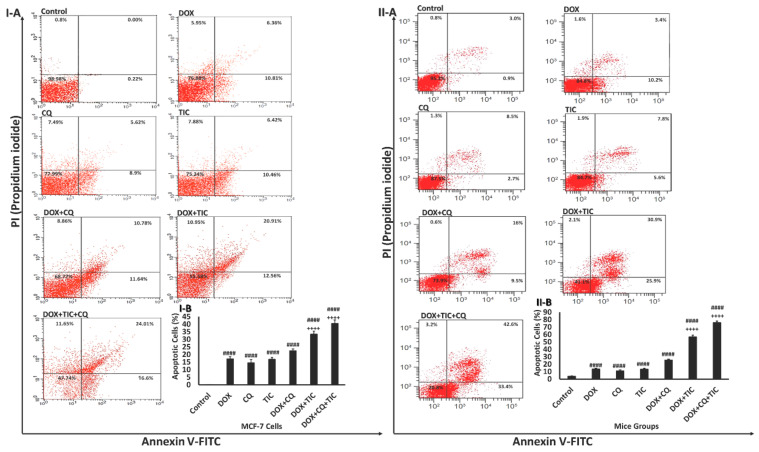
Figure 4.
Effect of DOX, CQ and TIC single or combination treatments on the apoptotic cell population. Flow cytometric analysis showed AnnexinV-FITC/PI stained of MCF-7 cells (I-A) and MCF-7 Xenograft mice (II-A) treated with single or combinatorial treatments. In each panel, the lower and upper left quadrants represent the percent of viable and the dead cells, respectively. The lower and upper right quadrants represent the percent of early and late apoptotic cells, respectively. Bar diagram showing means % of apoptotic cell numbers of MCF-7 cells (I-B) and MCF-7 Xenograft mice (II-B) treated with single or combinatorial treatments. Values are expressed as mean ± SE (n = 3). Means within columns carrying symbols are significantly different. # p < 0.05, ## p < 0.01, ### p < 0.001, #### p < 0.0001 compared with control (untreated group). + p < 0.05, ++ p < 0.01, +++ p < 0.001, ++++ p < 0.0001 compared with the DOX treated group.

