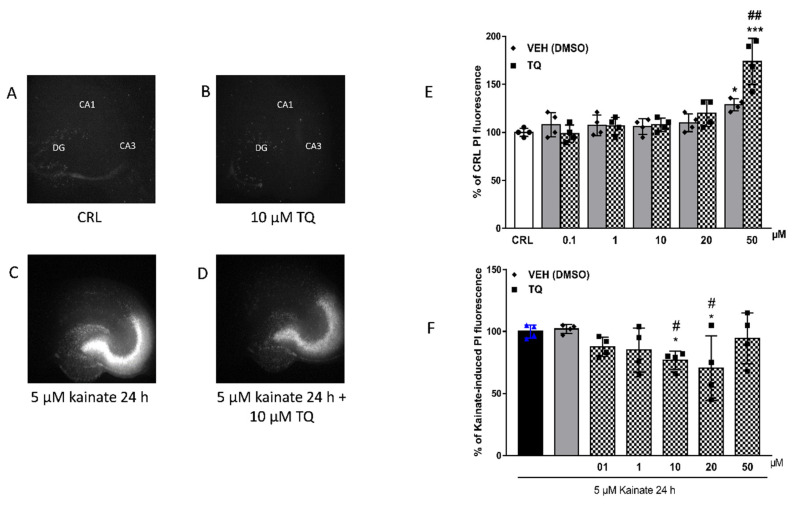
Figure 2.
Effects of TQ in organotypic hippocampal slice cultures exposed to KA. (A) representative hippocampal slice under normal conditions (background PI fluorescence); representative slice incubated with 10 µM of TQ in basal condition (B); representative slice exposed to 5 µM kainate 24 h displaying intense PI labelling in the CA3 subregion (C); TQ effect on KA-induced PI labelling (D). (E): Quantitative analysis of PI fluorescence measured after 24 h of incubation with TQ (0.1–50 µM) and its corresponding vehicle in basal condition. * p < 0.05, *** p < 0.001 vs. CRL and ## vs. corresponding vehicle (ANOVA + Tukey’s w-Test). (F) Quantitative analysis of PI fluorescence measured after 24 h of incubation with TQ (0.1-50 µM) and its corresponding vehicle in the Kainate-induced injury model. Bars represent the mean ± SEM of at least four experiments run in quadruplicate, from independent slice preparations (about 16 slices for each experimental point). * p < 0.05 vs. KA; # p < 0.05 vs. VEH (ANOVA + Tukey’s w-Test).

