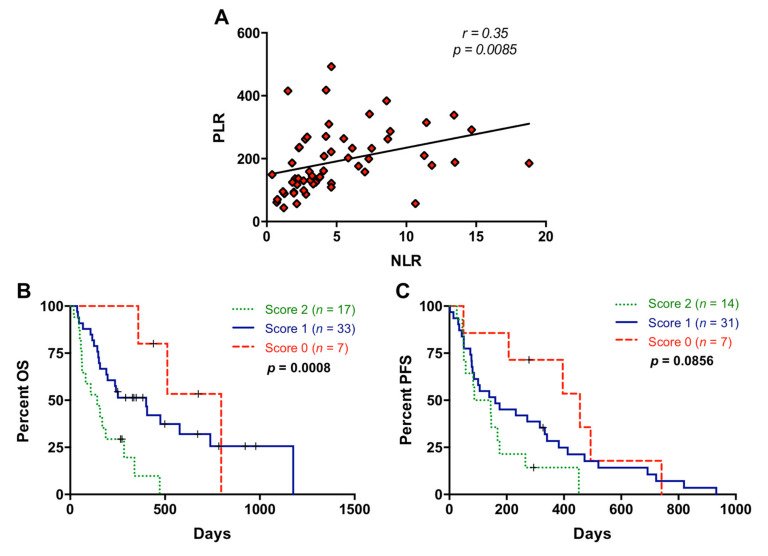
Figure 4.
Association between neutrophil–lymphocyte ratio and platelet–lymphocyte ratio. (A) Correlation between neutrophil–lymphocyte ratio (NLR) and platelet–lymphocyte ratio (PLR) values; (B) overall survival (OS) according to the NLR and PLR combination (score 2 compared to score 0: p = 0.0004, score 2 compared to score 1: p = 0.0040); (C) progression-free survival (PFS) according to the NLR and PLR combination (score 2 compared to score 0: p = 0.0097; score 2 compared to score 1: p = 0.1463) (score 2, positive for both markers; score 1, positive for one of them; score 0: negative for both markers).

