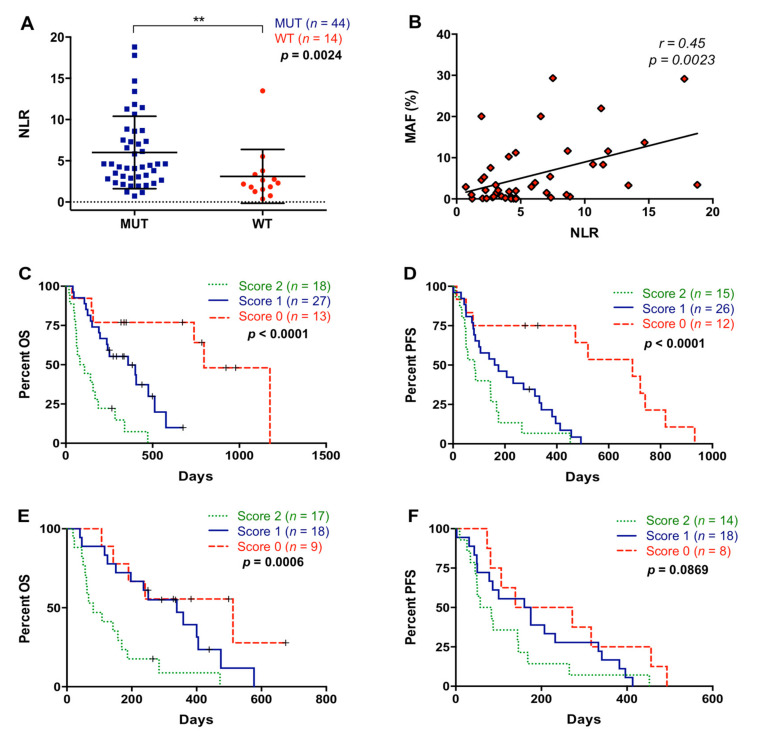
Figure 7.
Association between neutrophil–lymphocyte ratio and plasma RAS mutation. (A) Neutrophil–lymphocyte ratio (NLR) according to RAS mutational status in plasma; (B) correlation between NLR values and RAS mutant allelic fraction (MAF) in plasma; (C) overall survival (OS) according to the NLR and RAS mutational status combination (score 2 compared to score 0: p < 0.0001; score 2 compared to score 1: p = 0.0003); (D) progression-free survival (PFS) according to the NLR and RAS mutational status combination (score 2 compared to score 0: p = 0.0003; score 2 compared to score 1: p = 0.0533); (E) OS according to the NLR and MAF combination (score 2 compared to score 0: p = 0.0029; score 2 compared to score 1: p = 0.0037); (F) PFS according to the NLR and MAF combination (score 2 compared to score 0: p = 0.0420; score 2 compared to score 1: p = 0.3008) (score 2, positive for both markers; score 1, positive for one of them; score 0, negative for both markers) (** p < 0.01).

