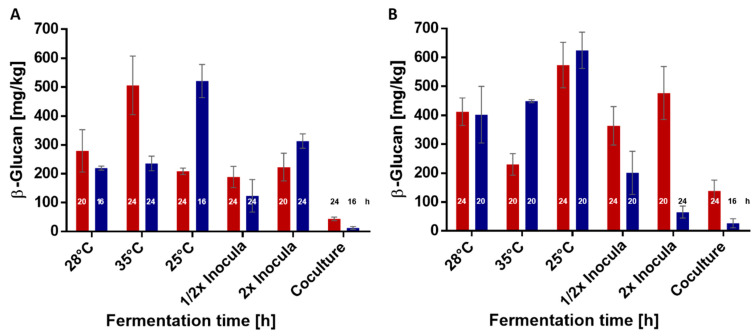
Figure 3.
Maximal β-glucan concentrations in fermented wheat and rye sourdoughs under different conditions. (A) L. brevis TMW 1.2112 (▋) and P. claussenii TMW 2.340 (▋) in wheat sourdough and (B) L. brevis TMW 1.2112 and P. claussenii TMW 2.340 in rye sourdough with the respective fermentation times in h. Values are means of biological triplicates including standard deviations.

